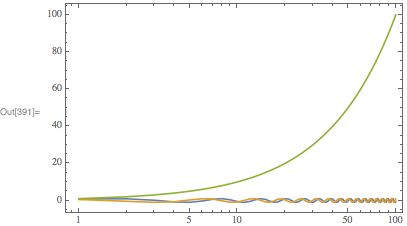
I've been attempting to use ScalingFunctions to scale the y-axis of my plot by $10^{10}$, however when I do, the frame ticks disappear and I'm not sure how to get it back. Currently I have 3 data files which I plot with
ListLinePlot[
  {ClFKdata1[[All, {1, 2}]], ClFKdata2[[All, {1, 2}]], ClFKdata3[[All, {1, 2}]]},
  ScalingFunctions -> {"Log", {10^10*# &, # &}},
  Frame -> True,
  LabelStyle -> {Large, Black},
  Axes -> False,
  MeshStyle -> Opacity[0],
  ImageSize -> 1000,
  FrameTicks -> {{{0, 2, 4, 6}, None}, {All, None}},
  FrameStyle ->
    {{"", Directive[FontOpacity -> 0, FontSize -> 0]},
     {"", Directive[FontOpacity -> 0, FontSize -> 0]}},
  PlotRange -> All]
to try and get ticks at 0, 2, 4 and 6, but I get
I've also tried All and Automatic, but that doesn't seem to work either


