1
$\begingroup$

How can I change the font size in automatic legending?

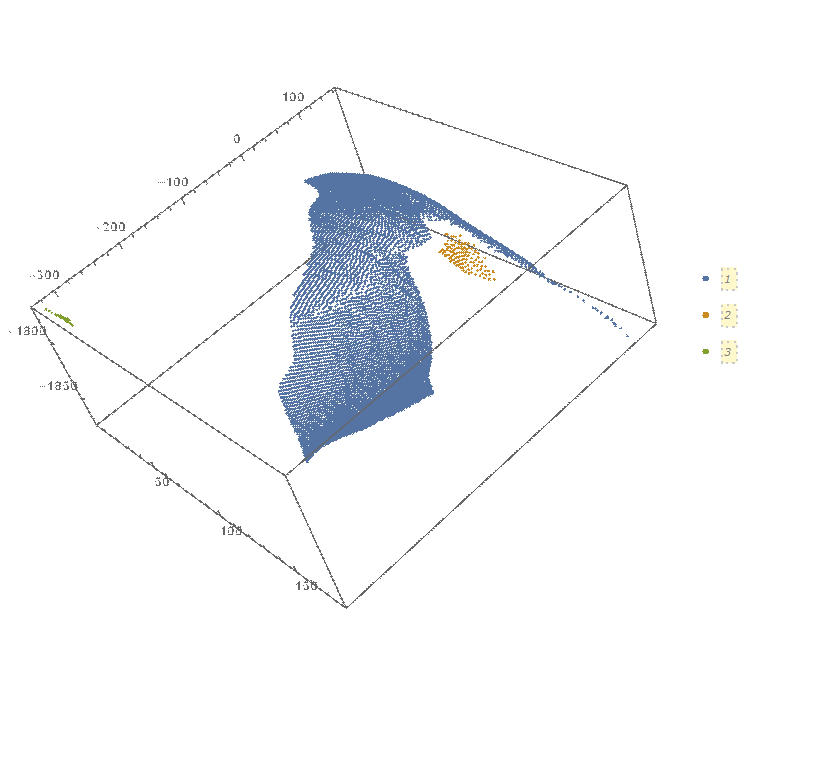
For example, In the attached image, I would like the numbering to be shown with the size of 18pt or so and bold. I am using the following script but not it does not give what I expect.

enter image description here

ListPointPlot3D[ccmp, 
 PlotLegends -> 
  PointLegend[Automatic, LabelStyle -> {FontSize -> 20, Bold}] ]
$\endgroup$
2
  • 2
    $\begingroup$ You may need to specify them explicity, like PlotLegends -> {Style[1, Bold, 22], Style[2, Bold, 22], Style[3, Bold, 22]} $\endgroup$
    – Jason B.
    Commented Jun 15, 2020 at 18:17
  • 1
    $\begingroup$ PlotLegends -> (Style[#, 22, Bold] & /@ Range[3]) $\endgroup$
    – Bob Hanlon
    Commented Jun 15, 2020 at 19:04

2 Answers 2

2
$\begingroup$

Placeholder, which is what those legends are using, has a hard-coded font size.

There are a couple of possibilities I can think of:

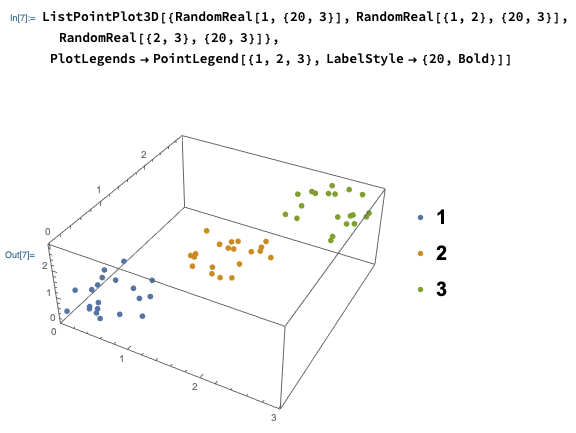
  • Use specific legend text, such as PointLegend[{1, 2, 3}, LabelStyle -> {20, Bold}]. This will have a larger size text while leaving the size of the point marker the same:

enter image description here

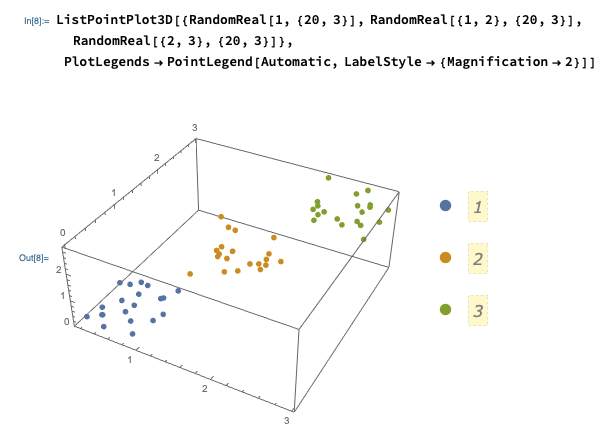
  • Use LabelStyle -> {Magnification -> 2} to set magnification, in which case the size of the point marker will also get larger, but you'll still have the placeholder legend labels:

enter image description here

$\endgroup$
1
$\begingroup$

Until we discover the right option to do this directly ...

We can post-process the legend object to modify the Placeholder labels:

ClearAll[modifyAutomaticLegendLabels, modifyLegend]

modifyAutomaticLegendLabels[style__, o : OptionsPattern[]] := 
 RawBoxes[ToBoxes[#] /. FrameBox[x_] :> FrameBox[StyleBox[x, style], o]] &

modifyLegend[style__, o : OptionsPattern[]] := # /. 
   l : _PointLegend | _LineLegend | _SwatchLegend :> 
        (modifyAutomaticLegendLabels[style, o]@l) &

Examples:

Row[modifyAutomaticLegendLabels[ 20, Red, Bold]@#[{Red, Green, Blue} , Automatic] & /@ 
  {PointLegend, LineLegend, SwatchLegend}, Spacer[20]]
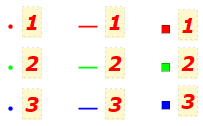
enter image description here

modifyLegend[Red, 16]@
 ListPointPlot3D[RandomReal[100, {3, 100, 3}], 
  PlotLegends -> PointLegend[Automatic, LegendFunction -> "Panel"]]
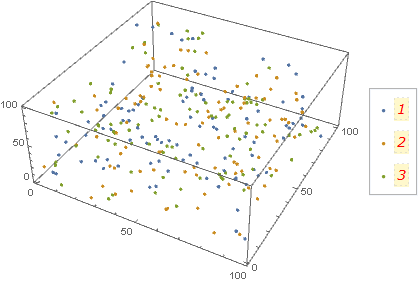
enter image description here

modifyLegend[Red, 16, Plain, FrameStyle -> Directive[Thick, Green]]@
 Plot[{Sin[x], Cos[x], Cos[x] Sin[x]}, {x, 0, 2 Pi}, 
   PlotLegends -> Automatic]
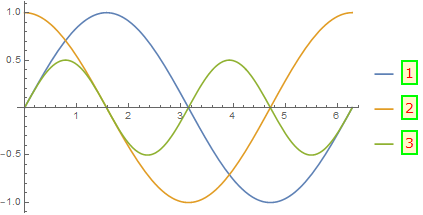
enter image description here

$\endgroup$

Your Answer

By clicking “Post Your Answer”, you agree to our terms of service and acknowledge you have read our privacy policy.

Not the answer you're looking for? Browse other questions tagged or ask your own question.