4
$\begingroup$

I have the double inequality $$G(n) = \left( \frac{1}{2} \right)^{\omega(n)} \tau(n)^2 < F(n) \leq \left( \frac{3}{4} \right)^{\omega(n)} \tau(n)^2 = H(n),$$ where $F(n) = \sum_{d \mid n} \tau(d)$. (What $\omega$ and $\tau$ are can be inferred from the code below.)

The question I have (which might be not appropriate) is: what might be a good way to plot this double inequality? Any suggestions would be appreciated.

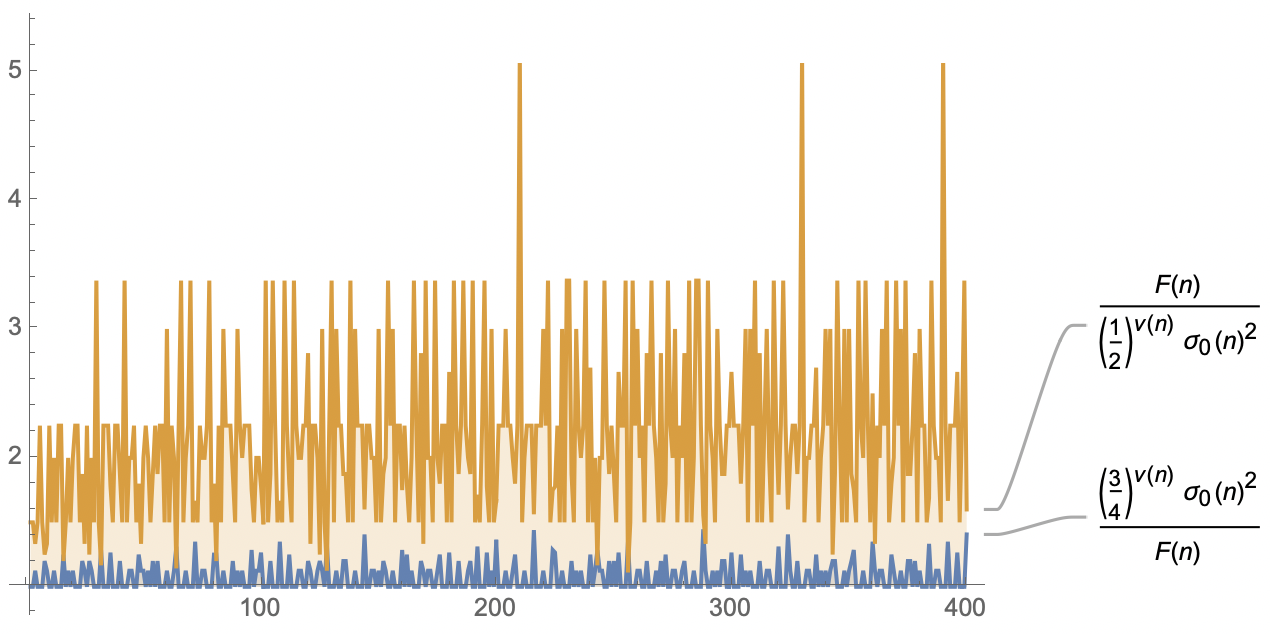
My best idea at present is to plot the two ratios $F(n)/G(n)$ and $H(n)/F(n)$ so that it can be seen from the plot that they both stay above $1$. The code I am using:

F[n_] := DivisorSum[n, DivisorSigma[0, #] &] 

DiscretePlot[{(3/4)^(PrimeNu[n])*(DivisorSigma[0, n])^2/F[n], 
F[n]/((1/2)^(PrimeNu[n])*(DivisorSigma[0, n])^2)}, {n, 2, 400}, 
PlotLabels -> Automatic]

enter image description here

$\endgroup$
5
  • 1
    $\begingroup$ Building off of that, I think it's nice to put $F(n)$ in the denominator each time, and shift the origin of the axes to {0,1}. Then the one bigger than $F(n)$ is above the axis, and the one smaller than $F(n)$ is below it: DiscretePlot[{(3/4)^(PrimeNu[n])*(DivisorSigma[0, n])^2/F[n], ((1/2)^(PrimeNu[n])*(DivisorSigma[0, n])^2)/F[n]}, {n, 2,400}, PlotLabels -> Automatic, AxesOrigin -> {0, 1}] $\endgroup$
    – thorimur
    Commented Mar 12, 2021 at 2:26
  • 1
    $\begingroup$ Another similar way is to not shift the axes origin, and use - instead of /, but then you'd also want a PlotRange -> Full, and the graph of that is a bit wilder, but they're more similar to each other. You also probably want to get rid of the x axis markers in this case. DiscretePlot[{(3/4)^(PrimeNu[n])*(DivisorSigma[0, n])^2 - F[n], ((1/2)^(PrimeNu[n])*(DivisorSigma[0, n])^2) - F[n]}, {n, 2, 400}, PlotLabels -> Automatic, PlotRange -> Full, Ticks -> {False, Automatic}] $\endgroup$
    – thorimur
    Commented Mar 12, 2021 at 2:29
  • $\begingroup$ I haven't yet tried the second suggestion, but the first one already makes the plot much better. $\endgroup$
    – the_fox
    Commented Mar 12, 2021 at 2:55
  • $\begingroup$ Feel free to post an answer by the way. $\endgroup$
    – the_fox
    Commented Mar 12, 2021 at 3:14
  • $\begingroup$ Ok, posted these comments as an answer! $\endgroup$
    – thorimur
    Commented Mar 12, 2021 at 6:18

2 Answers 2

2
$\begingroup$

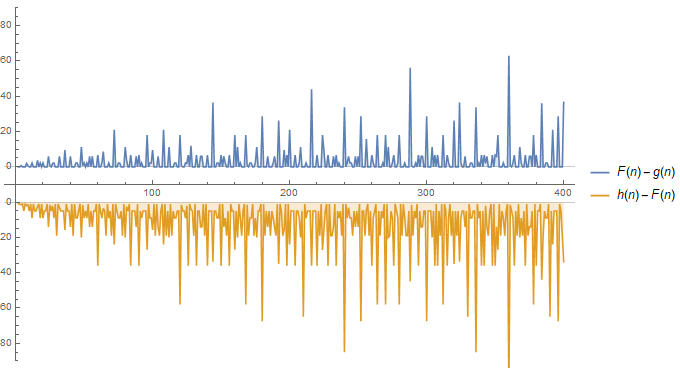
A variation on thorimur's second method: We can use custom ticks for the vertical axis and put a gap between the two curves to have the horizontal axis visible:

ClearAll[g, h, F]
g[n_] := (1/2)^PrimeNu[n] DivisorSigma[0, n]^2
h[n_] := (3/4)^PrimeNu[n]*DivisorSigma[0, n]^2
F[n_] := DivisorSum[n, DivisorSigma[0, #] &]

gap = 20;
vticks = Join[Charting`FindTicks[{-100 - gap/2, -gap/2}, {100, 0}][-100-gap/2, -gap/2],
   Charting`FindTicks[{gap/2, 100 + gap/2}, {0, 100}][gap, 100 + gap/2]];

DiscretePlot[{gap/2 + h[n] - F[n], g[n] - F[n] - gap/2}, {n, 2, 400},
 Filling -> {1 -> gap/2, 2 -> -gap/2}, 
 Ticks -> {Automatic, vticks}, 
 PlotLegends -> {HoldForm[F[n] - g[n]], HoldForm[h[n] - F[n]]},
 ImageSize -> Large, PlotRange -> {-100, 100}, 
 GridLines -> {None, {-gap/2, gap/2}}]

enter image description here

$\endgroup$
4
$\begingroup$

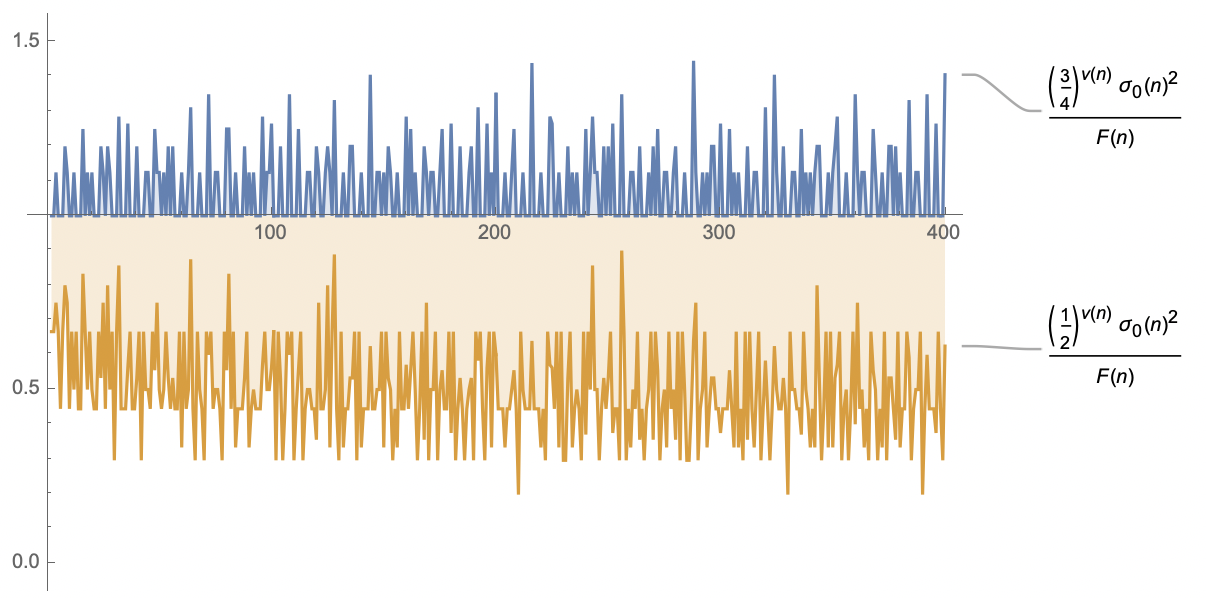
Building off of what you have, I think it's nice to put $F(n)$ in the denominator each time, and shift the origin of the axes to {0,1}. Then the one bigger than $F(n)$ is above the axis, and the one smaller than $F(n)$ is below it:

DiscretePlot[{(3/4)^(PrimeNu[n])*(DivisorSigma[0, n])^2/F[n],
  ((1/2)^(PrimeNu[n])*(DivisorSigma[0, n])^2)/F[n]}, {n, 2,400},
  PlotLabels -> Automatic, AxesOrigin -> {0, 1}]

A plot generated by the above code.

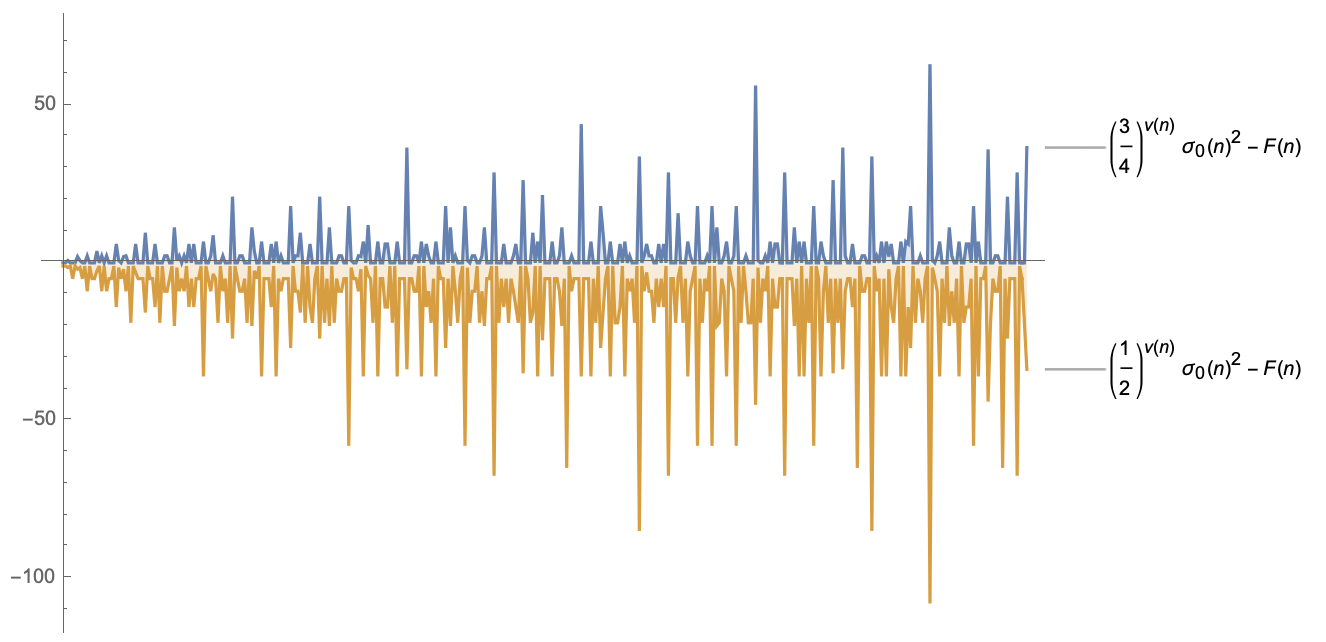
Another similar way is to use - instead of /, and keep the axis where it is originally. In this case you'd also want PlotRange -> Full; the graph of this is a bit wilder, but not as lopsided from top to bottom. You'd also probably want to get rid of the x-axis markers in this case, as they overlap with the curves:

DiscretePlot[{(3/4)^(PrimeNu[n])*(DivisorSigma[0, n])^2 - F[n],
  ((1/2)^(PrimeNu[n])*(DivisorSigma[0, n])^2) - F[n]}, {n, 2, 400},
  PlotLabels -> Automatic, PlotRange -> Full, Ticks -> {False, Automatic}]

A plot generated by the above code.

$\endgroup$
2
  • $\begingroup$ I'll wait a little before accepting in case anyone else feels like contributing something different. $\endgroup$
    – the_fox
    Commented Mar 12, 2021 at 6:28
  • $\begingroup$ yeah, no problem! I sort of expected someone would come in with something much better, which was why I put it in a comment in the first place. $\endgroup$
    – thorimur
    Commented Mar 12, 2021 at 7:19

Your Answer

By clicking “Post Your Answer”, you agree to our terms of service and acknowledge you have read our privacy policy.

Not the answer you're looking for? Browse other questions tagged or ask your own question.