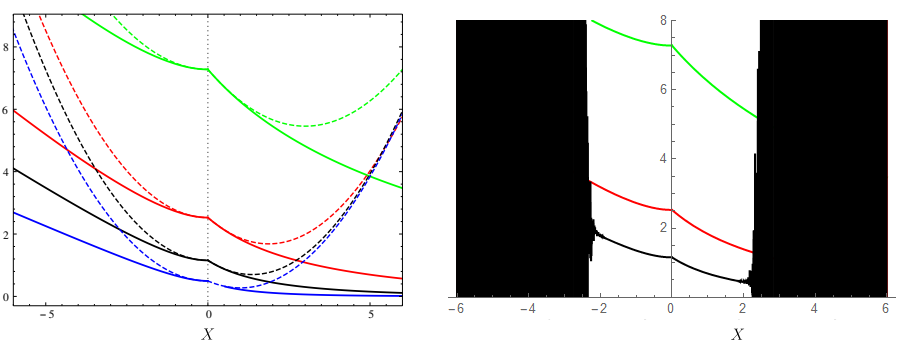
I'm trying to reproduce some plots from the analytical expression:
$f(\xi)=\left(\frac{2}{\beta^2}-1\right)+\left(\frac{\theta\,e^{-\beta}}{2}-\frac{1}{2}\right)\xi+\sum_{n=1}^{60}\left[\frac{(-\beta)^n}{n!}\xi^{1+n/2}\zeta_H\left(-\frac{n}{2},1+\frac{1}{\xi}\right)\right]$.
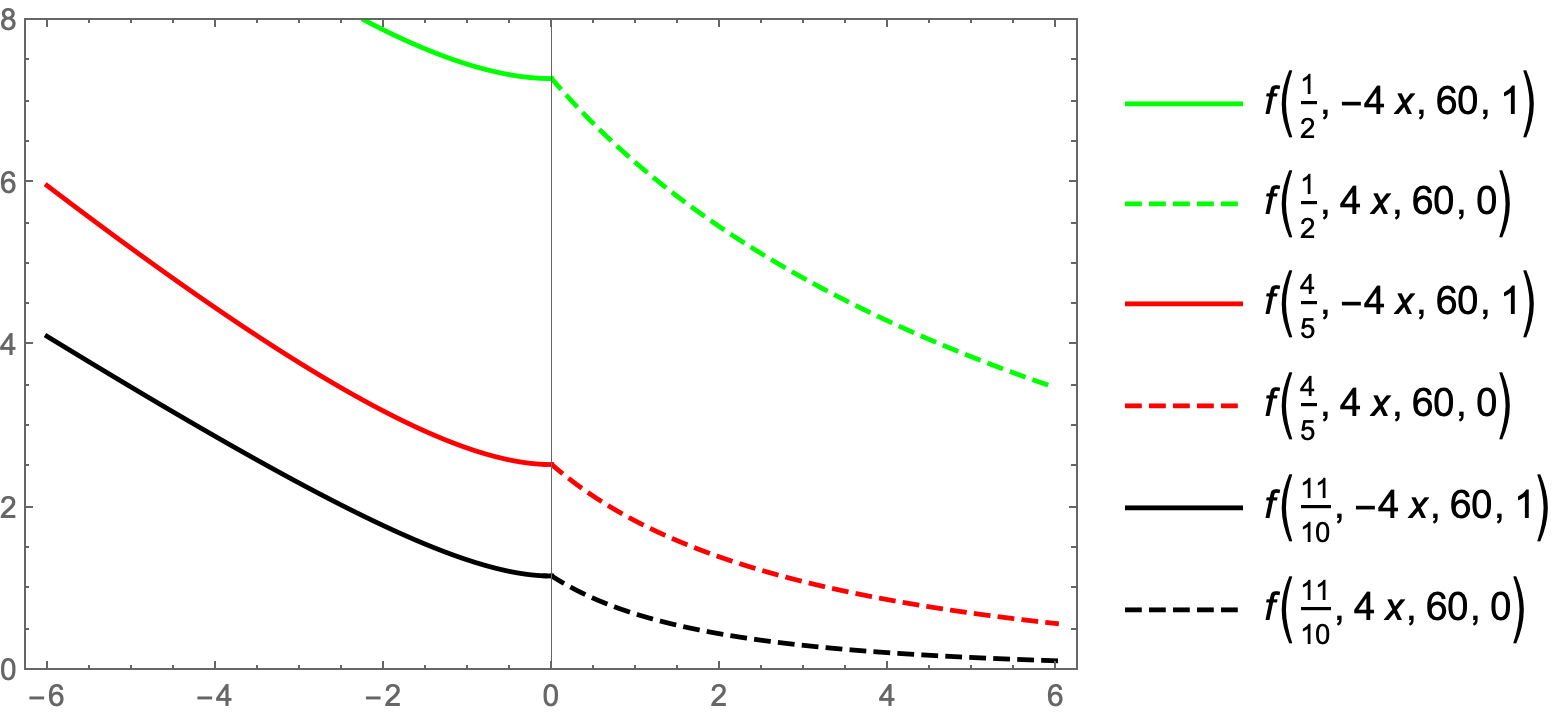
I need to plot $f(-4x)$ for several values of $\beta$ and with $\theta=0$ and $\theta=1$. In the attached picture, the left panel is what I have to get (ignore the blue curves), but Mathematica gives me a lot of noise.
f[β_, ξ_,M_, θ_] := ((2/β^2 -1) + ((θ Exp[-β])/2 - 1/2) ξ + Sum[((-β)^n ξ^(1 + n/2))/n! HurwitzZeta[-(n/2), 1 + 1/ξ], {n, 1, M}]);

Plot[{f[0.5, -4 x, 60, 1], f[0.5, 4 x, 60, 0],
  f[0.8, -4 x, 60, 1], f[0.8, 4 x, 60, 0], f[1.1, -4 x, 60, 1],
  f[1.1, 4 x, 60, 0]}, {x, -6, 6}, AxesOrigin -> {0, 0},
 PlotStyle -> {Green, Green, Red, Red, Black, Black},
 PlotRange -> {0, 8}]
Do you have an idea of what is going on?
Thanks!


WorkingPrecision -> 30inPlot[]. $\endgroup$