2
$\begingroup$

I have 3 functions: $$ \left(v(\text{k$\_$})=\frac{\partial \omega (k)}{\partial k}\right)\\ \left(g(\text{k$\_$})=\frac{a n}{\pi | v(k)| }\right)\\ \left(\omega (\text{k$\_$})=\sqrt{\frac{2 (f (1-\cos (2 a k))+\kappa (1-\cos (a k)))}{m}}\right) $$

Now, I want to plot $g(\omega)$ instead of $g(k)$. Is there a simple way to do it?

That is, I don't want $g(\omega(k))$. I want $g(k)$ plotted against each $\omega(k)$ corresponding to each $k$.

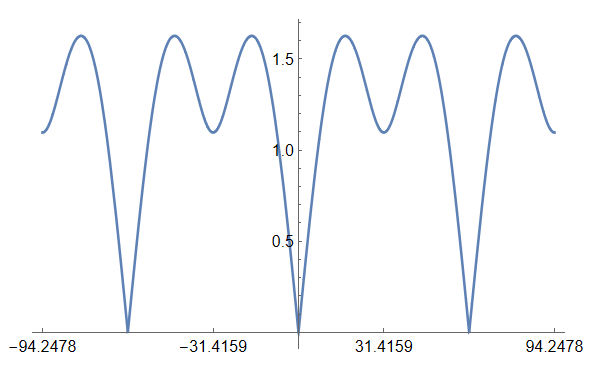
Here are the plots for $\omega(k)$: omega(k)
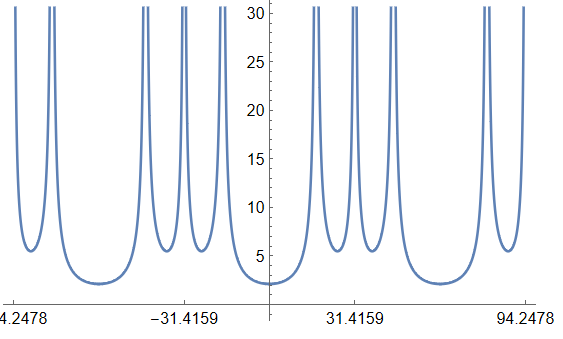
And $g(k)$:

g(k)\

And here's ParametricPlot[{ ω[k], g[k]}, {k, 0, x}]:

parametric plot

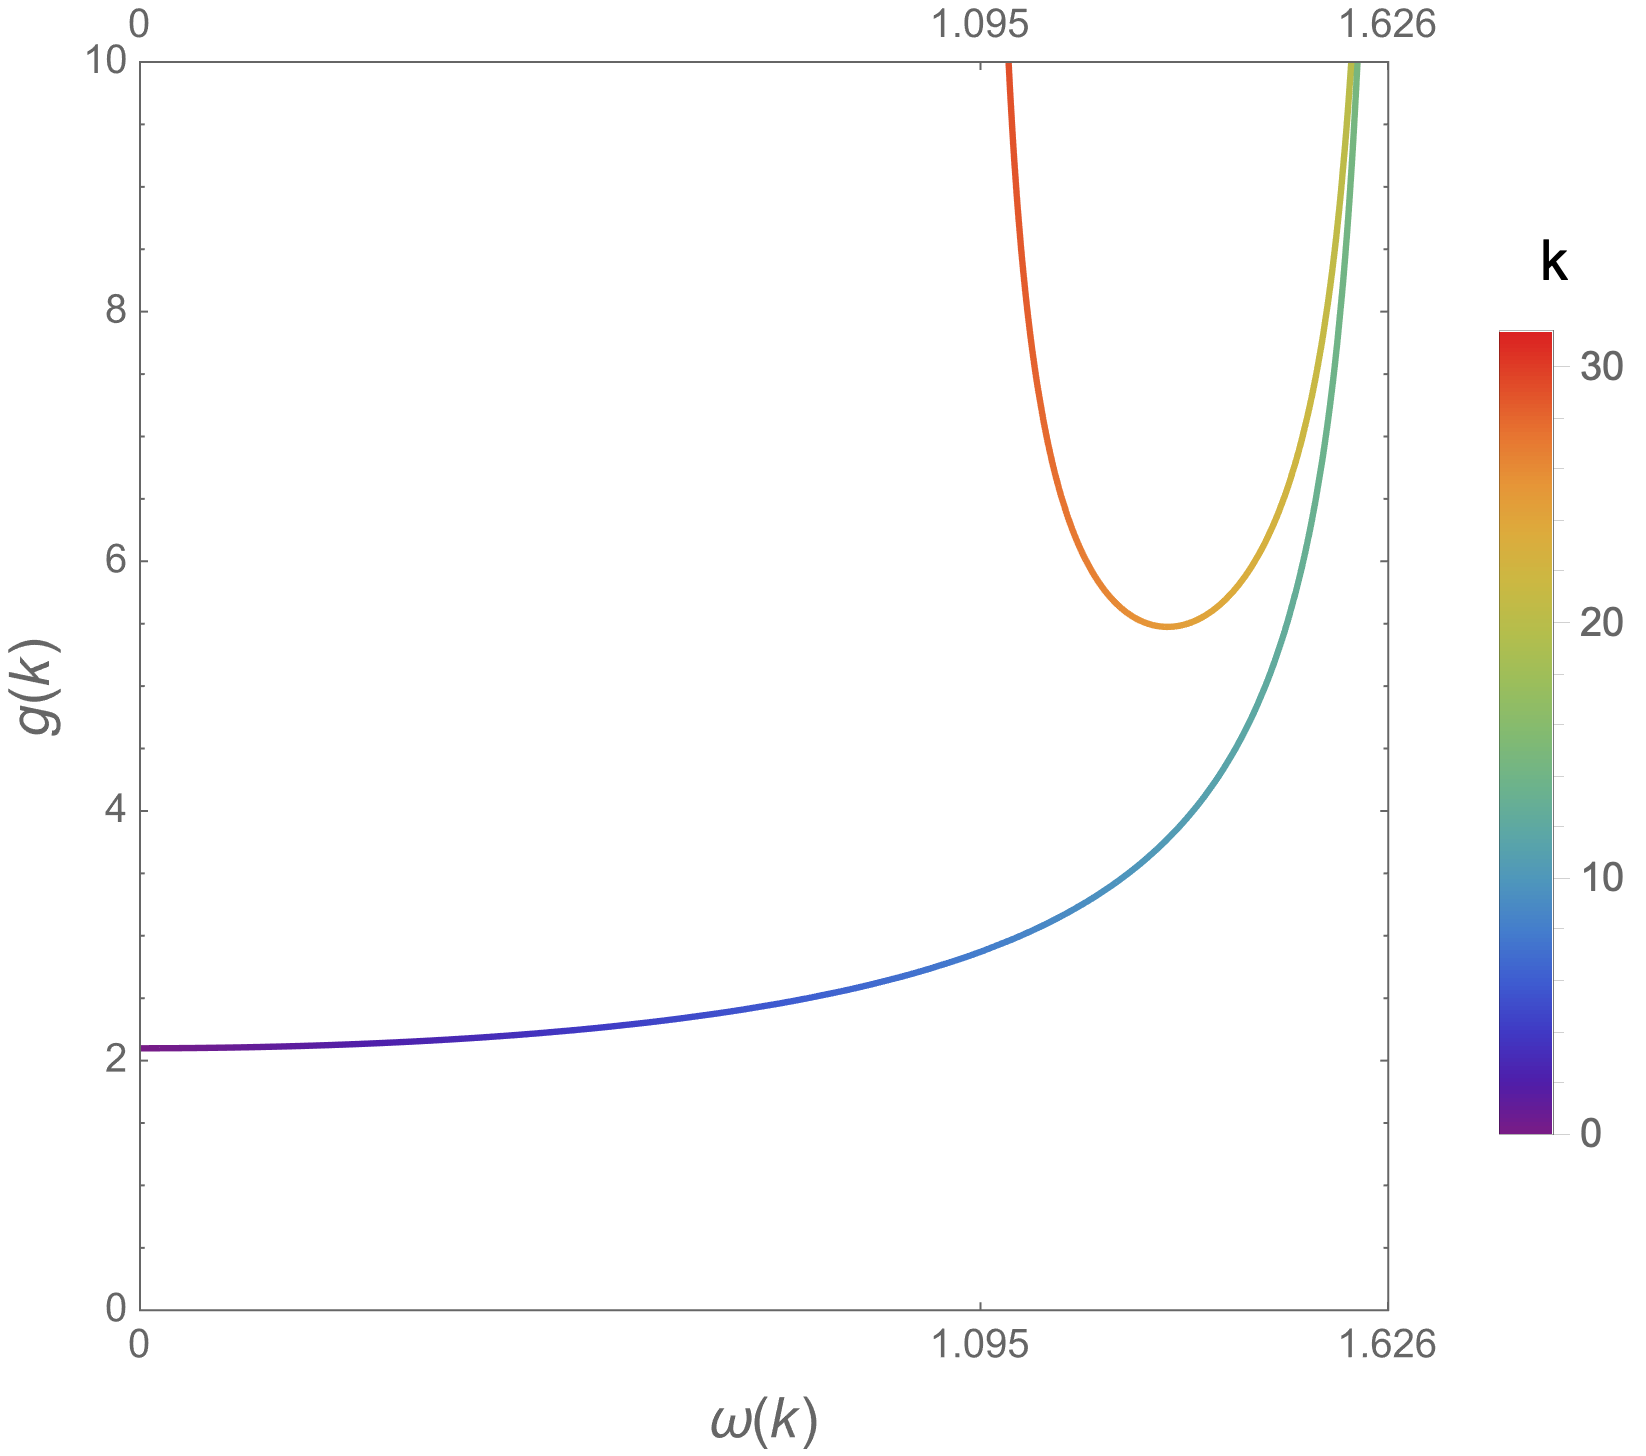
It doesn't produce what I want. My guess is that's because $\omega$ is not 1-to-1?

Here's the code:

Clear["Global`*"]
ω[k_] = 
  Sqrt[2/m (κ (1 - Cos[k a]) + f (1 - Cos[2 k a]))];
v[k_] = D[ω[k], k];
g[k_] = n a/π 1/Abs[v[k]];
x = π/a;
κ = 3;
f = 5;
m = 10;
a = 0.1;
Plot[ω[k], {k, -3 x, 3 x}, 
 Ticks -> {{-3 x, -x, 0, x, 3 x}, Automatic}]
Plot[ω[k]/k, {k, -3 x, 3 x}, 
 Ticks -> {{-3 x, -x, 0, x, 3 x}, Automatic}]
Plot[v[k], {k, -3 x, 3 x}, Ticks -> {{-3 x, -x, 0, x, 3 x}, Automatic}]
n = 10;
Plot[g[k], {k, 0, x}, 
 Ticks -> {{0, 17.21364599572073, x}, {20, 40, 60}}, 
 PlotRange -> {{0, x}, {0, 60}}]
ParametricPlot[{ ω[k], g[k]}, {k, 0, x}, 
 PlotRange -> {{0, MaxValue[ω[k], k]}, {0, 10}}, 
 Ticks -> {{0, Round[ω[x], 0.001], 
    Round[MaxValue[ω[k], k], 0.001]}, Automatic}, 
 Exclusions -> None]
$\endgroup$
5
  • 4
    $\begingroup$ ParametricPlot $\endgroup$
    – cvgmt
    Commented Feb 23, 2022 at 1:05
  • $\begingroup$ Yeah, my problem is that it does a mess since omega is not one-to-one (last graph). Is there a way to fix it? $\endgroup$ Commented Feb 23, 2022 at 1:12
  • 2
    $\begingroup$ Look up AspectRatio $\endgroup$
    – Bill Watts
    Commented Feb 23, 2022 at 1:53
  • $\begingroup$ Please post your copy and paste-able code (InputForm) for the function definitions. Include the parameter values used for the plots. $\endgroup$
    – Bob Hanlon
    Commented Feb 23, 2022 at 2:04
  • $\begingroup$ Please post your Mathematica code instead of LaTeX. $\endgroup$
    – cvgmt
    Commented Feb 23, 2022 at 3:12

2 Answers 2

3
$\begingroup$
Clear["Global`*"]

κ = 3;
f = 5;
m = 10;
a = 1/10;
x = π/a;
n = 10;
ω[k_] = Sqrt[2/m (κ (1 - Cos[k a]) + f (1 - Cos[2 k a]))] // 
  Simplify;

v[k_] = D[ω[k], k];

g[k_] = n a/π 1/Abs[v[k]];

ωmax = MaxValue[{ω[k], 0 < k < x}, k] // Simplify

(* 23/(10 Sqrt[2]) *)

ParametricPlot[{ω[k], g[k]}, {k, 0, x},
 PlotRange -> {{0, ωmax}, {0, 10}},
 Frame -> True,
 FrameLabel -> (Style[#, 14] & /@ {HoldForm@ω[k], 
     HoldForm@g[k]}),
 FrameTicks -> {{0, Round[ω[x], 0.001], 
    Round[ωmax, 0.001]}, Automatic},
 Exclusions -> None,
 AspectRatio -> 1,
 ColorFunction -> 
  Function[{ω, g, k}, ColorData["Rainbow"][k]],
 PlotLegends -> BarLegend[{"Rainbow", {0, x}},
   LegendLabel -> Style["k", 14]]]

enter image description here

$\endgroup$
1
$\begingroup$

In this case you can get g[w] directly in analytical form.

Clear["Global`*"]

\[Kappa] = 3;
f = 5;
m = 10;
a = 1/10;
x = \[Pi]/a;
n = 10;
\[Omega][k_] = 
   Sqrt[2/m (\[Kappa] (1 - Cos[k a]) + f (1 - Cos[2 k a]))];
v[k_] = D[\[Omega][k], k];
g[k_] = n a/\[Pi] 1/Abs[v[k]];
\[Omega]max = NMaxValue[\[Omega][k], k]

sol = Solve[{g[k] == gg, \[Omega][k] == ww, 0 < k}, gg, k, Reals, 
   Method -> Reduce];

{gw1[ww_], gw2[ww_], gw3[ww_]} = gg /. List @@ sol;

Plot[Evaluate[{gw1[ww], gw2[ww], gw3[ww]}], {ww, 0, \[Omega]max}, 
   PlotStyle -> {Red, Green, Blue}]

gw2[13/10]

(*   (100 (191 - 3 Sqrt[191]))/(1337 \[Pi])   *)

You can transform the Root expressions in gw1,gw2,gw3 to radical form, but attention, sometimes //ToRadicals does wrong.

$\endgroup$

Your Answer

By clicking “Post Your Answer”, you agree to our terms of service and acknowledge you have read our privacy policy.

Not the answer you're looking for? Browse other questions tagged or ask your own question.