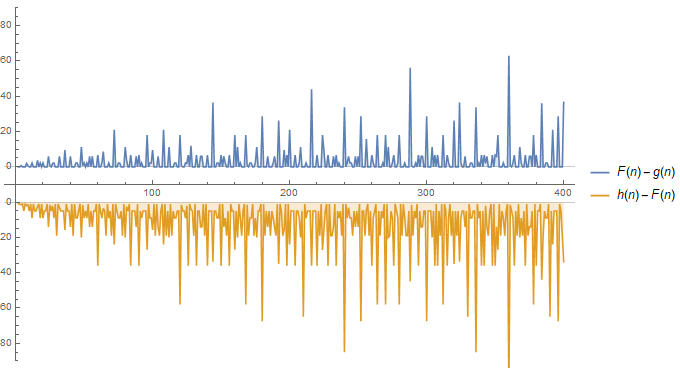
I have the double inequality $$G(n) = \left( \frac{1}{2} \right)^{\omega(n)} \tau(n)^2 < F(n) \leq \left( \frac{3}{4} \right)^{\omega(n)} \tau(n)^2 = H(n),$$ where $F(n) = \sum_{d \mid n} \tau(d)$. (What $\omega$ and $\tau$ are can be inferred from the code below.)
The question I have (which might be not appropriate) is: what might be a good way to plot this double inequality? Any suggestions would be appreciated.
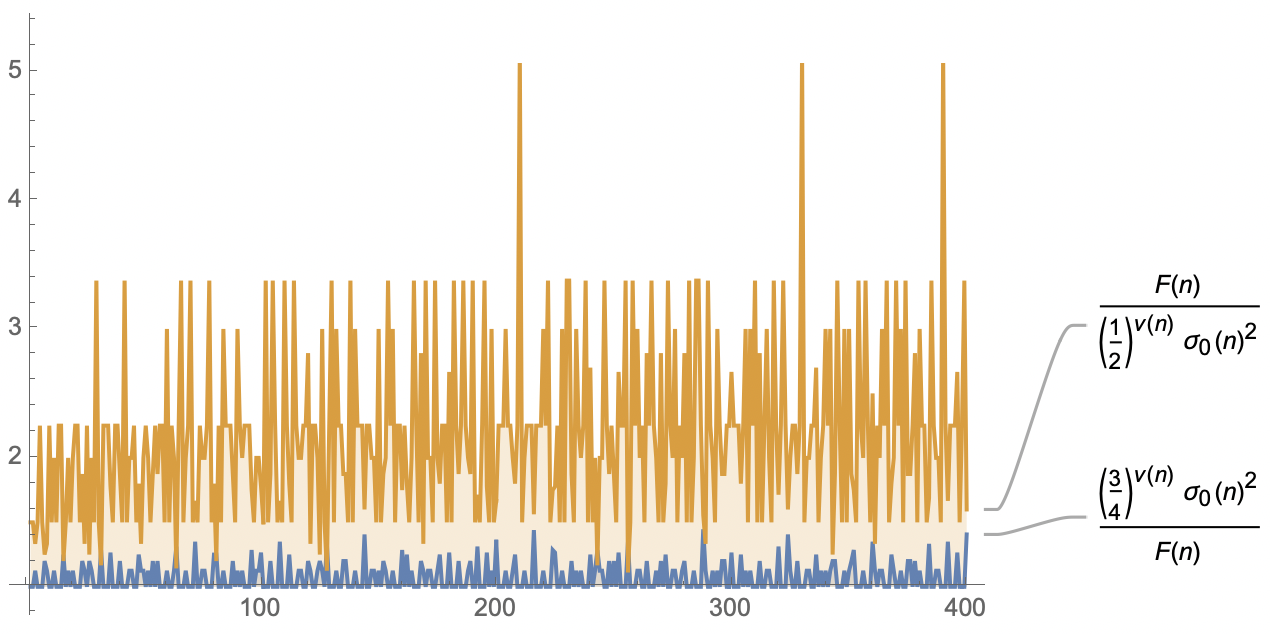
My best idea at present is to plot the two ratios $F(n)/G(n)$ and $H(n)/F(n)$ so that it can be seen from the plot that they both stay above $1$. The code I am using:
F[n_] := DivisorSum[n, DivisorSigma[0, #] &]

DiscretePlot[{(3/4)^(PrimeNu[n])*(DivisorSigma[0, n])^2/F[n],
F[n]/((1/2)^(PrimeNu[n])*(DivisorSigma[0, n])^2)}, {n, 2, 400},
PlotLabels -> Automatic]


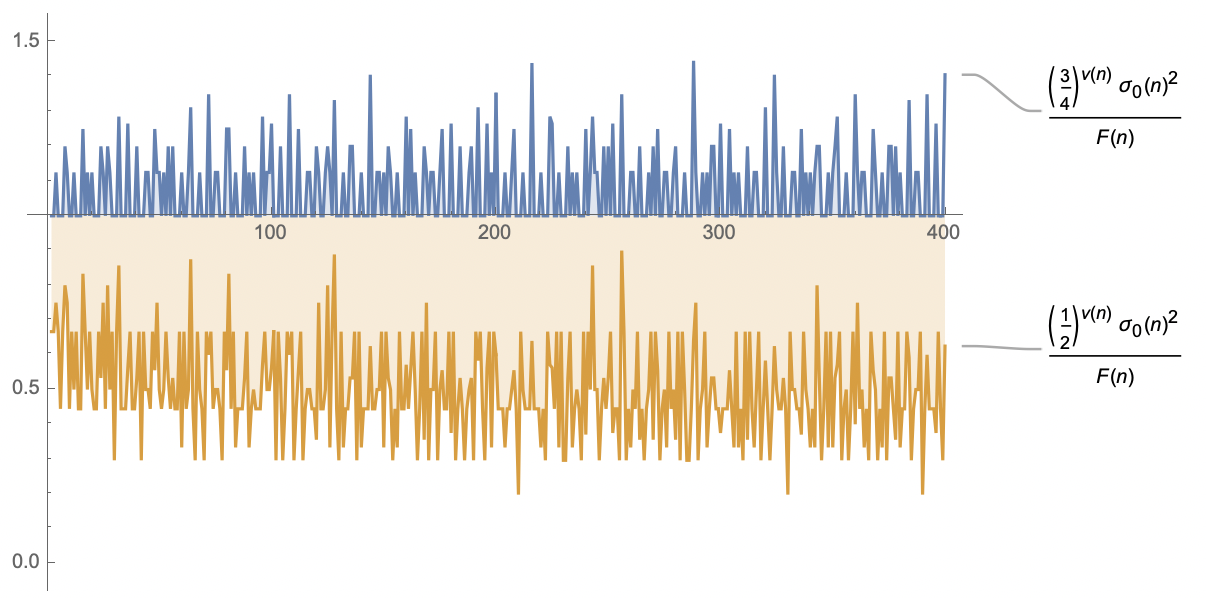
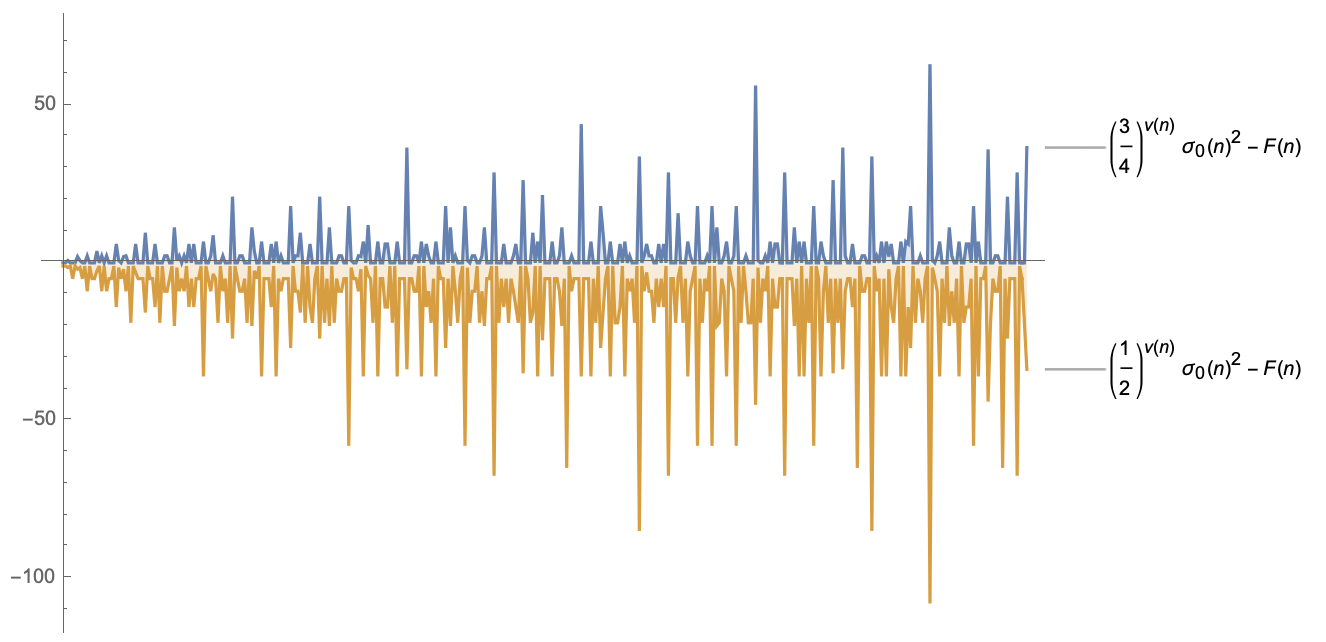
{0,1}. Then the one bigger than $F(n)$ is above the axis, and the one smaller than $F(n)$ is below it:DiscretePlot[{(3/4)^(PrimeNu[n])*(DivisorSigma[0, n])^2/F[n], ((1/2)^(PrimeNu[n])*(DivisorSigma[0, n])^2)/F[n]}, {n, 2,400}, PlotLabels -> Automatic, AxesOrigin -> {0, 1}]$\endgroup$-instead of/, but then you'd also want aPlotRange -> Full, and the graph of that is a bit wilder, but they're more similar to each other. You also probably want to get rid of the x axis markers in this case.DiscretePlot[{(3/4)^(PrimeNu[n])*(DivisorSigma[0, n])^2 - F[n], ((1/2)^(PrimeNu[n])*(DivisorSigma[0, n])^2) - F[n]}, {n, 2, 400}, PlotLabels -> Automatic, PlotRange -> Full, Ticks -> {False, Automatic}]$\endgroup$