I have a continous function f(x,y), and I want the 2D plot of its sign. I then created a function
sign=Sign[f]
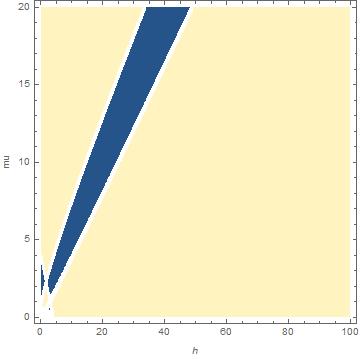
and used ContourPlot: what I obtained is this graph
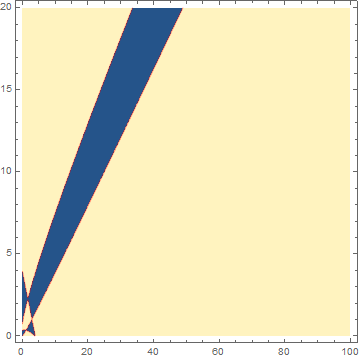
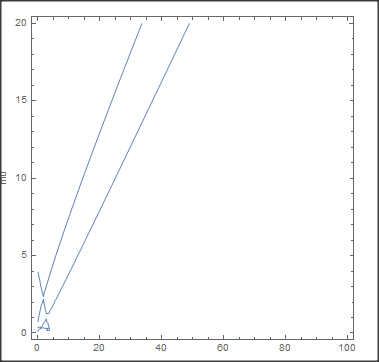
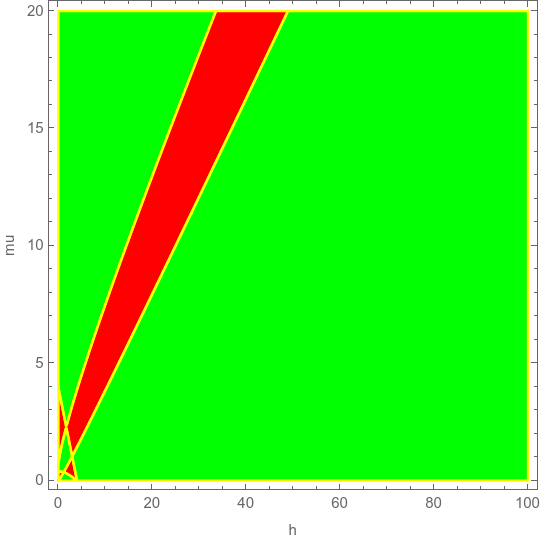
where the blue region corresponds to -1 and the yellow region to 1. Can I get rid of the white region? It does not depend on the function, as there are points in it with -1 or 1 sign.
Thank you in advance!
EDIT: the exact expression of f, in its original variables h and mu, is
1/mu^4*( 0.0562706 (-0.308221 + Sqrt[0.1 + h + mu]) (-2.01155 +
   1. Sqrt[0.1 + h + mu]) (-0.324443 - 3.24443 h - 11.7611 mu +
   1. Sqrt[0.1 + h + mu]) (-0.049713 - 0.49713 h - 1.8021 mu +
   1. Sqrt[0.1 + h + mu]) (-0.0431301 - 0.431301 h + 1. mu -
   0.737425 Sqrt[0.1 + h + 1.09109 mu]) (-0.0431301 - 0.431301 h +
   1. mu + 0.133495 Sqrt[0.1 + h + 1.09109 mu]) (-0.309516 + Sqrt[
   0.1 + h + 1.09109 mu]) (1.70977 + 1. Sqrt[0.1 + h + 1.09109 mu]))


f? $\endgroup$RegionPlotmore useful here sinceContourPlotworks best with continuous functions. $\endgroup$