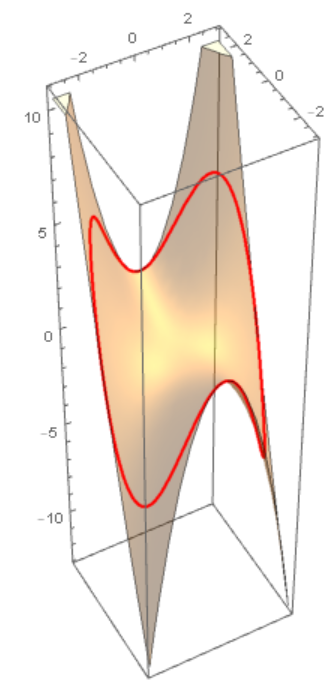
I wanted to plot a function of two variables so I have decided to make use of Mathematica.
The function is
$z =\ ( 1 / 6) \ y^2 + \ ( \pi \ / 6 )(x^2y) $
where
$\ y=\sqrt{9-x^2} $
Sorry for what may be a simple question, but how do I plot the graph with the restriction on y?
I have written this code
 Plot3D[1/6  * (y)^2 + Pi/6* x^2 * (y), {x, -3, 3}, {y, Sqrt[9 - x^2],
  Sqrt[9 - x^2]}]
But I get a wireframe type of graph back.
How can I get a filled in graph which depicts the function along with its restriction? Thank you.


Plot3D[1/6*(y)^2 + Pi/6*x^2*(y), {x, -3, 3}, {y, Sqrt[9 - x^2], Sqrt[9 - x^2]}, ViewPoint -> Front]andPlot[1/6*(y)^2 + Pi/6*x^2*(y) /. y -> Sqrt[9 - x^2], {x, -3, 3}]. The second makes the substitution prior to plotting. $\endgroup$With[{y=Sqrt[9-x^2]},ParametricPlot3D[{x, y, y^2/6 +x^2 y \[Pi]/6}, {x, -3, 3}]]? $\endgroup$With[{y = Sqrt[9 - x^2]}, ParametricPlot3D[{x, y, u (y^2/6 + x^2 y Pi/6)}, {x, -3, 3}, {u, 0, 1}]]$\endgroup$