1
$\begingroup$

I want to plot the partial Fourier series of a function. I have this:

f[x_] := x; 
T = 2;
a0 = 2/T*Integrate[f[x], {x, -1, 1}];
a[k_] := 2/T*Integrate[f[x]*Cos[2*Pi*k/T*x], {x, -1, 1}];
b[k_] := 2/T*Integrate[f[x]*Sin[2*Pi*k/T*x], {x, -1, 1}];
g[x_, n_] := 
  a0/2 + Sum[a[k]*Cos[2*Pi*k/T*x], {k, 1, n}] + 
   Sum[b[k]*Sin[2*Pi*k/T*x], {k, 1, n}];
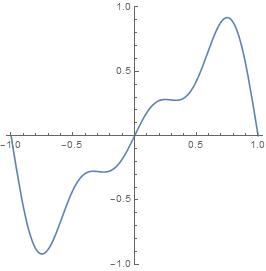
g[x, 3]
Plot[%, {x, -1, 1}, PlotRange -> {-1, 1}, AspectRatio -> 1]

enter image description here

I want to plot the graphs for several of them, with 'n' varying. If posible with 'Animate'.

$\endgroup$
2
  • 1
    $\begingroup$ Have you seen this? $\endgroup$ Commented Jan 18, 2021 at 2:03
  • $\begingroup$ I solved it, big thanks. $\endgroup$ Commented Jan 18, 2021 at 3:23

4 Answers 4

2
$\begingroup$
f[x_] := x;
T = 2;
a0 = 2/T*Integrate[f[x], {x, -1, 1}];
a[k_] := 2/T*Integrate[f[x]*Cos[2*Pi*k/T*x], {x, -1, 1}];
b[k_] := 2/T*Integrate[f[x]*Sin[2*Pi*k/T*x], {x, -1, 1}];
g[x_, n_] := 
  a0/2 + Sum[a[k]*Cos[2*Pi*k/T*x], {k, 1, n}] + 
   Sum[b[k]*Sin[2*Pi*k/T*x], {k, 1, n}];

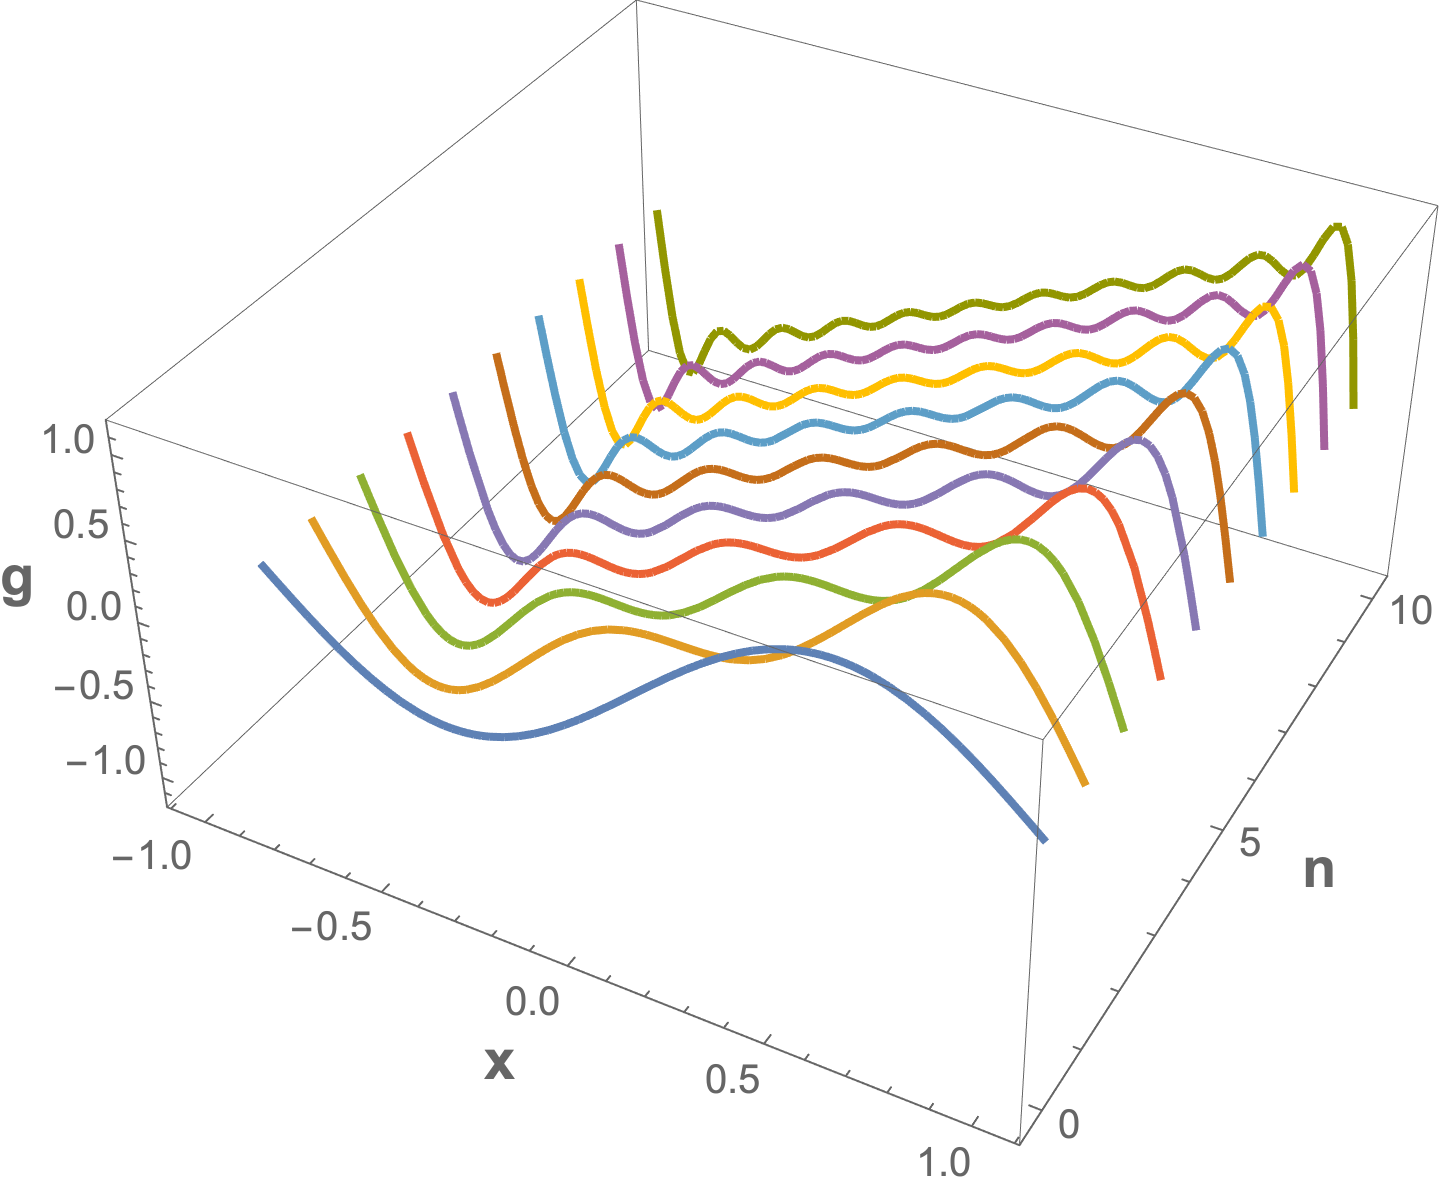
To look at all plots at once

ParametricPlot3D[
 Evaluate[{x, #, g[x, #]} & /@ Range[10]],
 {x, -1, 1},
 BoxRatios -> {1, 1, 1/2},
 AxesLabel -> (Style[#, 14, Bold] & /@
    {"x", "n", "g "})]

enter image description here

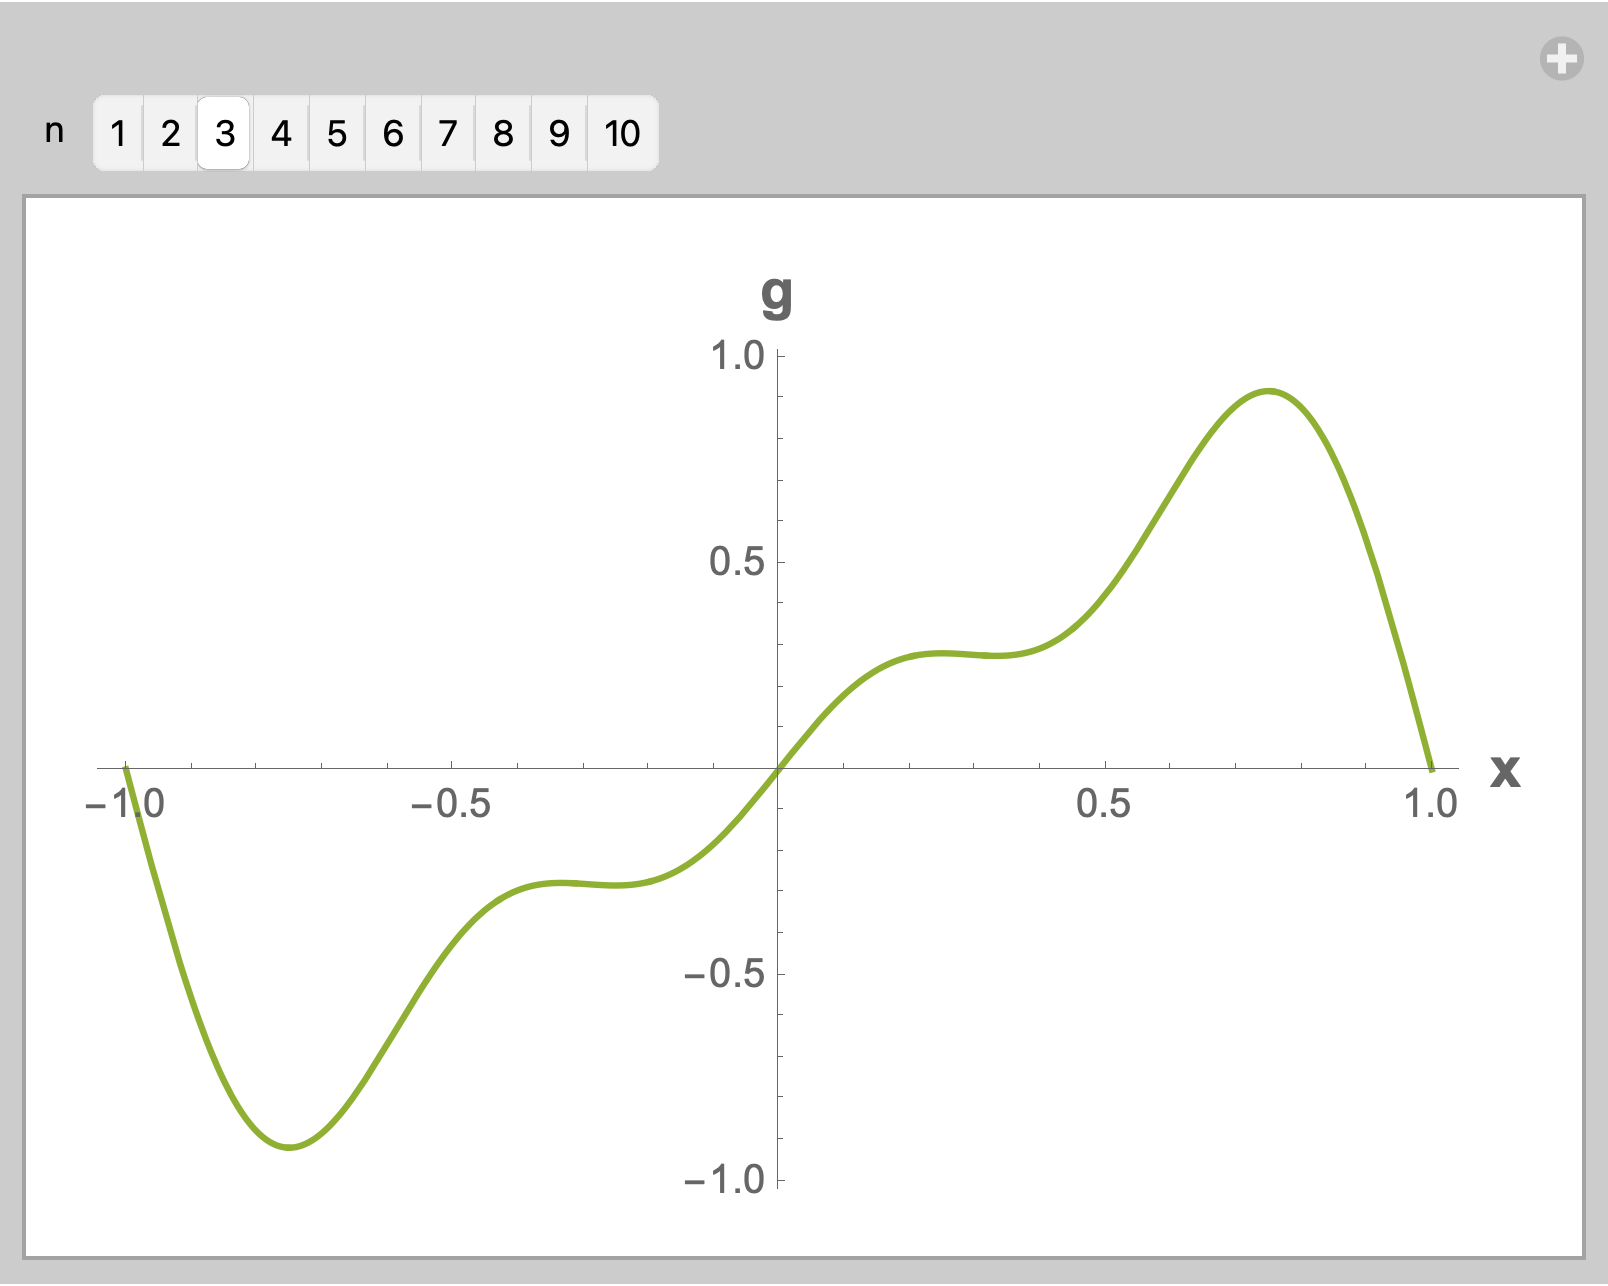
To selectively look at each individual plot

Manipulate[
 Plot[Evaluate@g[x, n], {x, -1, 1},
  AxesLabel -> (Style[#, 14, Bold] & /@
     {"x", "g"}),
  PlotStyle -> ColorData[97][n]],
 {{n, 3}, Range[10], ControlType -> SetterBar}]

enter image description here

$\endgroup$
2
$\begingroup$
f[x_] := x; 
T = 2;
a0 = 2/T*Integrate[f[x], {x, -1, 1}];
a[k_] := 2/T*Integrate[f[x]*Cos[2*Pi*k/T*x], {x, -1, 1}];
b[k_] := 2/T*Integrate[f[x]*Sin[2*Pi*k/T*x], {x, -1, 1}];
g[x_, n_] := 
  a0/2 + Sum[a[k]*Cos[2*Pi*k/T*x], {k, 1, n}] + 
   Sum[b[k]*Sin[2*Pi*k/T*x], {k, 1, n}];
Manipulate[
 Plot[Evaluate[g[x, n]], {x, -1, 1}, PlotRange -> {-1.1, 1.1}, 
  AspectRatio -> 1], {n, 1, 10, 1}]
$\endgroup$
1
$\begingroup$
f[x_] := x;
T = 2;
a0 = 2/T*Integrate[f[x], {x, -1, 1}];
a[k_] := 2/T*Integrate[f[x]*Cos[2*Pi*k/T*x], {x, -1, 1}];
b[k_] := 2/T*Integrate[f[x]*Sin[2*Pi*k/T*x], {x, -1, 1}];
g[x_, n_] := 
  a0/2 + Sum[a[k]*Cos[2*Pi*k/T*x], {k, 1, n}] + 
   Sum[b[k]*Sin[2*Pi*k/T*x], {k, 1, n}];
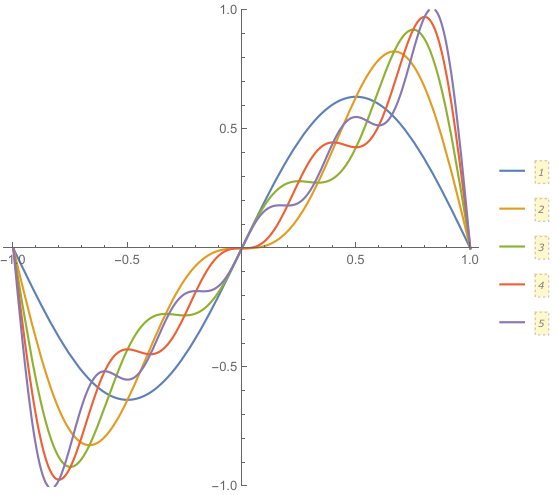
g[x, 3]
Plot[Tooltip@Table[g[x, n], {n, 5}] // Evaluate, {x, -1, 1}, 
 PlotRange -> {-1, 1}, AspectRatio -> 1, PlotLegends -> Automatic]
Manipulate[
 Plot[Tooltip@Table[g[x, n], {n, i}] // Evaluate, {x, -1, 1}, 
  PlotRange -> {-1, 1}, AspectRatio -> 1, 
  PlotLegends -> Automatic], {i, Range[5]}]

enter image description here

$\endgroup$
1
$\begingroup$
f[x_] := x;
T = 2;
(*
a0 = 2coe[f, Cos, T, 0]
a[k_] := coe[f, Cos, T, k]
b[k_] := coe[f, Sin, T, k]
*)
coe[func_, type: Cos | Sin, per_, order_Integer] := coe[func, type, per, order] = Module[
    {min = -per/2, max = per/2, factor = If[order == 0, 1/2, 1], x},
    Return[
        (2factor)/per Integrate[func[x] type[(2\[Pi] order)/per x], {x, min, max}]
]];
(*
g[x_, n_] := partsum[f, T, n][x]
*)
partsum[func_, per_, order_Integer] := partsum[func, per, order] = Module[
    {},
    x\[Function]
        Sum[
            coe[func, Sin, per, i] Sin[(2\[Pi] i)/per x] + 
            coe[func, Cos, per, i] Cos[(2\[Pi] i)/per x], 
        {i, 0, order}]
];
(* Interpolation *)
partsumtrans[func_, per_, order1_Integer, order2_Integer, tall_] 
    /;order2>order1 := 
    partsumtrans[func, per, order1, order2, tall] = 
    Module[{nth = order2 - order1},
        t\[Function](
            x\[Function](
                (1-SawtoothWave[nth t/tall])
                partsum[func, per, 
                     order1+Floor[t/tall nth]][x]+
                SawtoothWave[nth t/tall]
                partsum[func, per, 
                     order1+Floor[t/tall nth]+1][x]))
]

Now we can use them to construct a demonstration:

Manipulate[Plot[partsumtrans[f, T,  0, 3, 10][t][x], {x, -1, 1}, 
    PlotRange->1, 
    PlotLegends->If[IntegerQ@(3/10t), "n="<>ToString[0+3/10t],
        "n="<>ToString[Floor[0+3/10t]]<>
        " to "<>"n="<>ToString[Ceiling[0+3/10t]]], 
    PlotLabel->TraditionalForm[
        FullSimplify[partsumtrans[f, T, 0, 3, 10][t][x]]]
    ], {t, 0, 10}, 
    AppearanceElements->All,
    ContentSize->{500, 460},
    Alignment->{0, 0}]
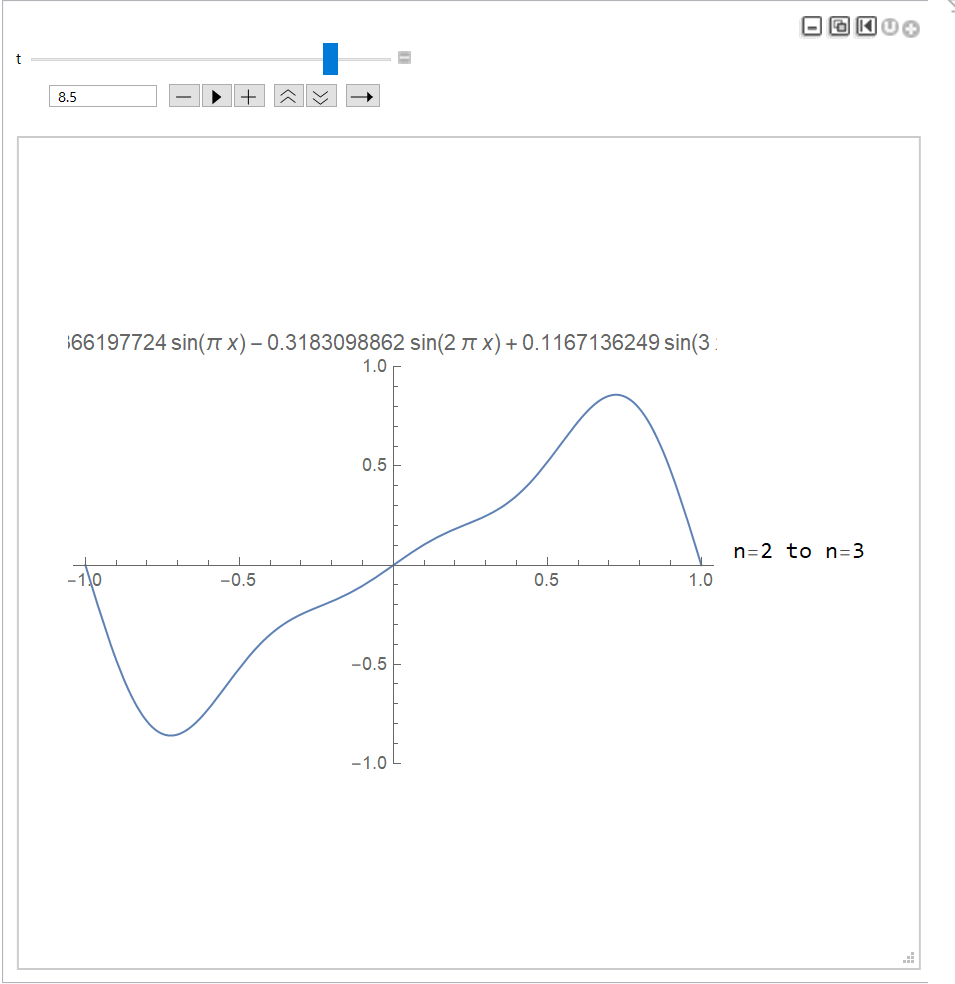
enter image description here

@Bob Hanlon Style:

Show[ParametricPlot3D[
    Evaluate[{x, 2#/10, partsum[f, T, #][x]}&/@Range[0, 10]],
    {x, -1, 1},
    PlotStyle->Thick
],
ParametricPlot3D[
    {x, y, partsumtrans[f, T, 0, 10, 2][y][x]},
    {x, -1, 1}, {y, 0, 2},
    Exclusions->None,
    Mesh->None, PlotStyle->Directive[Opacity[.5]],
    ColorFunction->"Rainbow",
    PlotPoints->30
]]
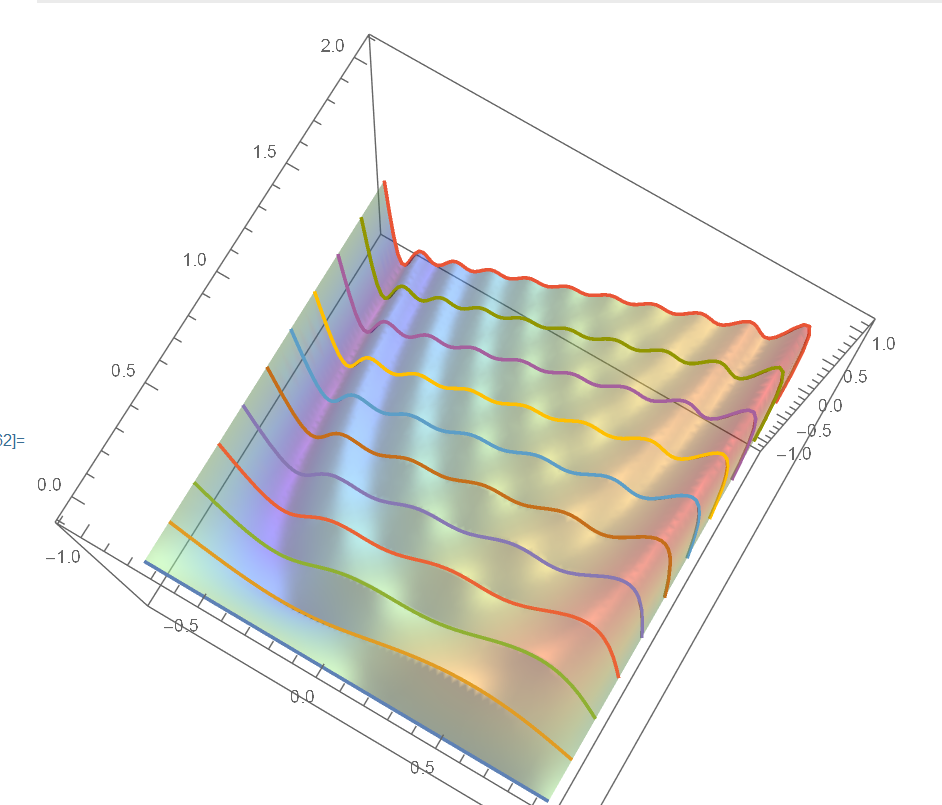
enter image description here

Or like @cvgmt's:

DynamicModule[{t},
    Column[{Dynamic@Plot[
        Evaluate[{partsumtrans[f, T, 0, 5, 1][t][x]}~Join~
        (partsum[f, T, #][x]&/@Range[0,5])],
        {x, -1, 1},
        PlotRange->{{-1, 1}, {-1.2, 1.2}},
        AspectRatio->Full,
        PlotStyle->{
            Red, 
            Sequence@@(
                Directive[
                    Thick, Opacity[.5], 
                    Dashed, ColorData[1][#]
                ]&/@Range[0, 5]
            )
        },
        ImageSize->Medium,
        PlotLegends->LineLegend[
            {"animate", Sequence@@(ToString@#&/@Range[0, 5])}
        ]
    ], Animator[Dynamic[t], 
                AnimationRunning->False, 
                AppearanceElements->{
                "PlayButton", "PauseButton", "ResetButton"}]},
        Alignment->Center           
    ]
]
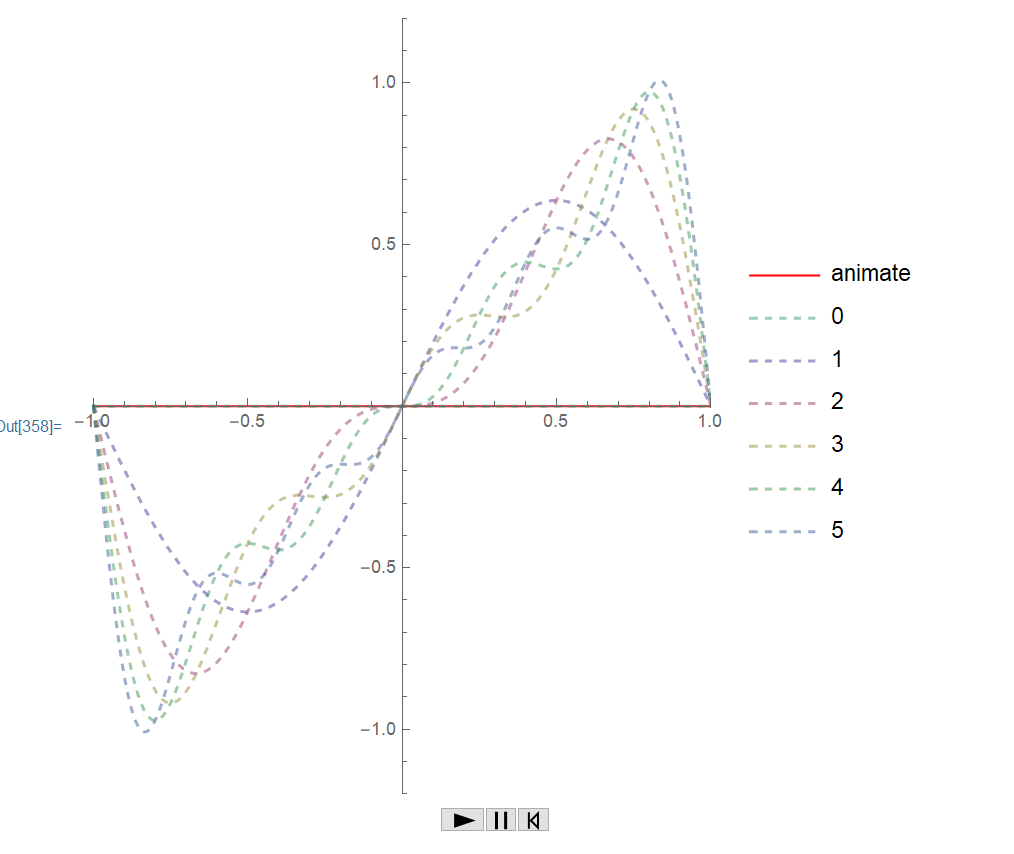
enter image description here

Also, you can change the interpolation-function partsumtrans to get a different performance.

$\endgroup$

Your Answer

By clicking “Post Your Answer”, you agree to our terms of service and acknowledge you have read our privacy policy.

Not the answer you're looking for? Browse other questions tagged or ask your own question.