2
$\begingroup$

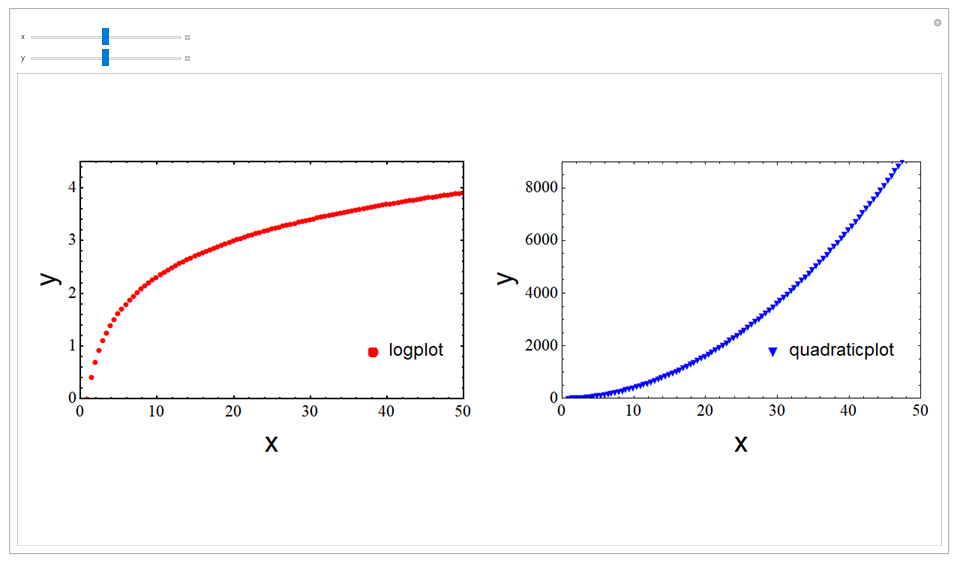
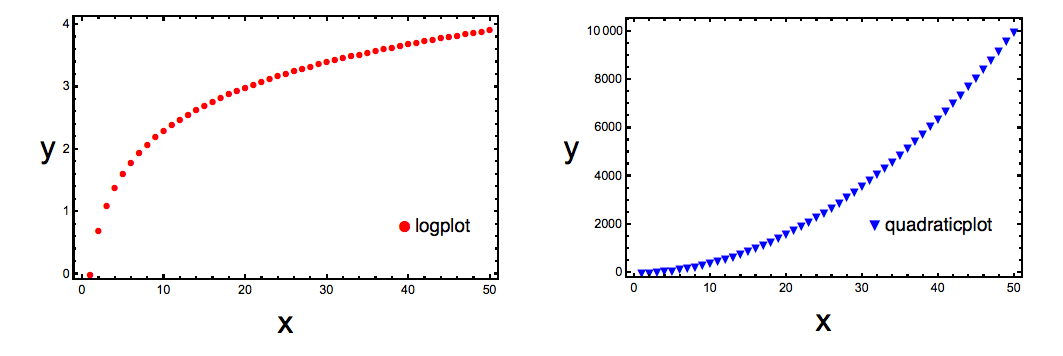
I have two figures that I merged side-by-side using Grid. I need to copy them and paste in MS Word to get a high resolution figure. I can copy a single figure by right clicking on it. However I can not copy both figures at once by selecting both of them at once. Another issue is how to customize both plots inside a grid by changing the space between the plots and aligning them. Can anyone please help me?

logplot = 
  ListPlot[Table[{i, Log[i]}, {i, 1, 50, 0.5}], 
   PlotStyle -> {Thickness[0.005], Red}, 
   PlotLegends -> Placed[{"logplot"}, {0.85, 0.2}], Frame -> True, 
   FrameStyle -> Directive[Black, Thickness[0.004]], 
   PlotMarkers -> {"\[FilledCircle]", 8}, 
   FrameLabel -> {Style["x", Black, FontFamily -> "Arial", 
      FontSize -> 25], 
      Style["y", Black, FontFamily -> "Arial", FontSize -> 25]}, 
   PlotRange -> {{0, 50}, {0, 4.5}}, FrameTicks -> Automatic, 
   ImageSize -> 400, 
   BaseStyle -> {FontFamily -> "Times", FontSize -> 15}];

quadraticplot = 
  ListPlot[Table[{i, 2 + 4*i^2}, {i, 1, 50, 0.5}], 
   PlotStyle -> {Thickness[0.005], Blue}, 
   PlotLegends -> Placed[{"quadraticplot"}, {0.75, 0.2}], 
   Frame -> True, FrameStyle -> Directive[Black, Thickness[0.004]], 
   PlotMarkers -> {"\[FilledDownTriangle]", 12}, 
   FrameLabel -> {Style["x", Black, FontFamily -> "Arial", 
      FontSize -> 25], 
      Style["y", Black, FontFamily -> "Arial", FontSize -> 25]}, 
   PlotRange -> {{0, 50}, {0, 9000}}, FrameTicks -> Automatic, 
   ImageSize -> 400, 
   BaseStyle -> {FontFamily -> "Times", FontSize -> 15}];

plot = Grid[{{logplot, quadraticplot}}]

Thank you in advance!

$\endgroup$
4
  • $\begingroup$ Try plot = GraphicsRow[{logplot, quadraticplot}]. Options control spacing & size, Export to png & import or select & copy as you like. $\endgroup$
    – dwa
    Commented Jan 2, 2021 at 7:25
  • $\begingroup$ Thank you for the suggestion. However I donot understand how to select and copy them? Another point is that when I export in to png and then import again to copy it, then the resolution becomes poor! Has there any alternatives except increasing resolution by using "imageresolution" which increases the file size abnormally. $\endgroup$
    – P Pyne
    Commented Jan 2, 2021 at 8:42
  • $\begingroup$ You can specify the resolution in Export: Try e.g.: Export["d:/tmp/test.png", plot, ImageResolution -> 100] $\endgroup$ Commented Jan 2, 2021 at 9:06
  • $\begingroup$ With Grid, you may change the spacing by inserting Spacer[nn] between the graphics, as in: Grid[{{logplot, Spacer[20], quadraticplot}}]. $\endgroup$
    – murray
    Commented Jan 2, 2021 at 16:01

2 Answers 2

1
$\begingroup$

Try this:

Manipulate[
 logplot = 
  ListPlot[Table[{i, Log[i]}, {i, 1, 50, 0.5}], 
   PlotStyle -> {Thickness[0.005], Red}, 
   PlotLegends -> Placed[{"logplot"}, {0.85, 0.2}], Frame -> True, 
   FrameStyle -> Directive[Black, Thickness[0.004]], 
   PlotMarkers -> {"\[FilledCircle]", 8}, 
   FrameLabel -> {Style["x", Black, FontFamily -> "Arial", 
      FontSize -> 25], 
     Style["y", Black, FontFamily -> "Arial", FontSize -> 25]}, 
   PlotRange -> {{0, 50}, {0, 4.5}}, FrameTicks -> Automatic, 
   ImageSize -> 400, 
   BaseStyle -> {FontFamily -> "Times", FontSize -> 15}];
 
 quadraticplot = 
  ListPlot[Table[{i, 2 + 4*i^2}, {i, 1, 50, 0.5}], 
   PlotStyle -> {Thickness[0.005], Blue}, 
   PlotLegends -> Placed[{"quadraticplot"}, {0.75, 0.2}], 
   Frame -> True, FrameStyle -> Directive[Black, Thickness[0.004]], 
   PlotMarkers -> {"\[FilledDownTriangle]", 12}, 
   FrameLabel -> {Style["x", Black, FontFamily -> "Arial", 
      FontSize -> 25], 
     Style["y", Black, FontFamily -> "Arial", FontSize -> 25]}, 
   PlotRange -> {{0, 50}, {0, 9000}}, FrameTicks -> Automatic, 
   ImageSize -> 400, 
   BaseStyle -> {FontFamily -> "Times", FontSize -> 15}, 
   AspectRatio -> 0.6596 + x];
 
 plot = Rasterize[
   GraphicsGrid[{{logplot, quadraticplot}}, Spacings -> 20 + y, 
    ImageSize -> {800, 400}], RasterSize -> 1200], {{x, 0}, -0.01, 
  0.01}, {{y, 0}, -10, 10}]

It must return the following:

enter image description here

and play a bit with the AspectRatio(x) and Spacings (y). The quality you can control by the RasterSize option. After you have fixed all parameters, remove Manipulate.

Then export it into the directory, where you have saved your notebook with this code:

Export[NotebookDirectory[] <> "myPlots.png", plot]

Then you will be able to import this saved image into Word.

Have fun!

$\endgroup$
2
  • $\begingroup$ I see you recommend exporting in png format. Please could you comment on the quality of the resulting plot? Should there be some consideration of resolution? $\endgroup$
    – Hugh
    Commented Jan 2, 2021 at 11:36
  • $\begingroup$ You can also use other formats of your liking. I, however, do not recommend to save as epl, since export in this format in Mma works bad. The resolution (giving you the plot quality) you can control with the options for the Rasterize function such as ImageResolution and RasterSize. Just play with them and see what do you like. My experience is that the quality is enough to be accepted to Phys. Rev. for illustrations to my papers. $\endgroup$ Commented Jan 2, 2021 at 12:57
1
$\begingroup$

I suggest you do something like this:

commonOpts = 
  Sequence[
    PlotRange -> All,
    Frame -> True,
    FrameStyle -> Directive[Black, AbsoluteThickness[1]], 
    FrameLabel -> {Style["x", Black, 25], Style["y", Black, 25]},
    RotateLabel -> False];

logplot =
  ListPlot[Table[{i, Log[i]}, {i, 1, 50, 1}],
    PlotLegends -> 
      Placed[
        Row[{Style["●", Red, 15], Style[" logplot", "SR", 15]}], 
        {0.85, 0.2}],
    PlotMarkers -> Style["●", 8, Red],
    commonOpts];  
  
quadraticplot =
  ListPlot[Table[{i, 2 + 4 i^2}, {i, 1, 50, 1}],
    AspectRatio -> 1.06 (1/GoldenRatio), 
    PlotLegends -> 
      Placed[
        Row[{Style["▼", Blue, 15], Style[" quadraticplot", "SR", 15]}], 
        {0.77, 0.2}],
    PlotMarkers -> Style["▼", 12, Blue],
    commonOpts];

GraphicsRow[{logplot, quadraticplot}, ImageSize -> 850, Spacings -> 50]

plots

Notes

  1. I have used Style rather than plot style options to localize control over fonts and colors.
  2. I had to tweek aspect ratio in quadraticplot to make the it the same size as logplot.
  3. I suppressed the rotation of the y-axis label because I think a single character label shouldn't be rotated.
$\endgroup$

Your Answer

By clicking “Post Your Answer”, you agree to our terms of service and acknowledge you have read our privacy policy.

Not the answer you're looking for? Browse other questions tagged or ask your own question.