0
$\begingroup$

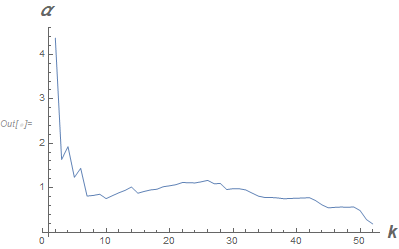
I am trying to get the Hill estimator of "alpha" and the Hill-plot graph from a standard Cauchy distribution. So, how to get it? Thanks!

Hill estimator can be outlined as follows.

  1. Generate a set X (for example, generate 100 variates from the Cauchy distribution)
  2. Order the elements of the set X in a decreasing fashion: Xi ≥ Xj, for i < j
  3. Construct the sets of Hk, for k>=2 (k=2,3,...,100): Hk=Σ{ln(Xj ) − ln(Xk)}/k , where j=1,2,...,k
  4. The set αk is defined by αk= 1/Hk

Since all elements in set αk should be real number, my coding below could not get the correct set of αk. Does someone know how to get the set of αk? Thanks!

X = RandomVariate[CauchyDistribution[0, 1], 100]
X = Sort[X, Greater]
t = {};
For[
  i = 1, i <= 99, i++; 
  a = 1/Mean[Log[X[[1 ;; i]]] - Log[X[[i]]]];
  T = AppendTo[t, a]
]
$\endgroup$
8
  • $\begingroup$ In step3, what is ln(Xj ) ? $\endgroup$ Commented Dec 19, 2020 at 15:09
  • $\begingroup$ @wuyudi, The elements of set X are in a decreasing order, which means the generated variates X1 >= X2 >= X3 >=...>= X100. Thus, Xj >=Xk. For example, if k=10, Xj= X1, X2, ...X10. So, I should get a2, a3, ... a100. $\endgroup$ Commented Dec 19, 2020 at 18:13
  • $\begingroup$ With a random sample from a CauchyDistribution[0,1], you're going to get complex numbers after taking the log about half of the time. Is that what you want? $\endgroup$
    – JimB
    Commented Dec 20, 2020 at 2:00
  • $\begingroup$ @JimB, all ak should be real number. Could you find how to get all ak real number? $\endgroup$ Commented Dec 20, 2020 at 2:04
  • $\begingroup$ The log of a negative number is complex and if you take the log of the absolute value, then you're not using the definition of the Hill estimator that you give. Other than ignoring complex numbers (which you can do at your peril), I don't know if you can get there from here. In my answer below, the values become complex with $k>56$. $\endgroup$
    – JimB
    Commented Dec 20, 2020 at 2:08

1 Answer 1

2
$\begingroup$

You should avoid uppercase letters for variables and For loops:

n = 100
SeedRandom[12345];
x = RandomVariate[CauchyDistribution[0, 1], n];
x = Sort[x, Greater];
α = Table[{k, 1/Mean[Log[x[[1 ;; k - 1]]] - Log[x[[k]]]]}, {k, 2, n}];
ListPlot[α, AxesLabel -> (Style[#, 18, Italic, Bold] &) /@ {"k", "α"},
  Joined -> True, PlotRange -> All]

Hill plot

$\endgroup$

Your Answer

By clicking “Post Your Answer”, you agree to our terms of service and acknowledge you have read our privacy policy.

Not the answer you're looking for? Browse other questions tagged or ask your own question.