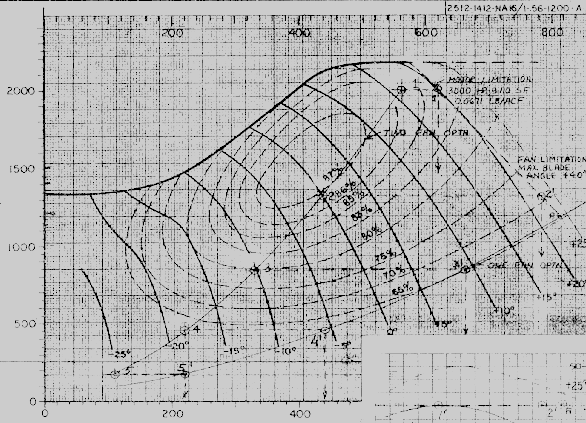
For the image below, would like to make the heavy black downward sloping lines more prominent and the fine gridlines in the background less prominent.
Also, would like to provide operations for the user, something like, "increase" and "decrease".
The goal would be that applying the increase operation once and the decrease operation once should return the original image.
Context for this question is that we are making a general tool. The image below is just one example. The goal for the question is to identify the appropriate functions for this operation.
ImageAdjust as used below seems to achieve the goal of making the heavy black downward sloping lines more prominent. But this operation might not be easily reversible, because ImageAdjust uses the equation (b+1)(c+1)x^1 -c/2, and the value of x may be different at each point. So, the coefficients to invert the operation will not be the same.
image00 = Import[FileNameJoin[{NotebookDirectory[], "image_00.png"}]]
imageAdj01 = ImageAdjust[image00, {0.5, 0., 0.3} ]
imageAdj02 = ImageAdjust[imageAdj01, {0, -0.2, 1} ]
imageAdj03 = ImageAdjust[imageAdj01, {1, -0.35, 1} ]
This is the original image. Note the fine grid in the background will distract the user from the key features of the plot.
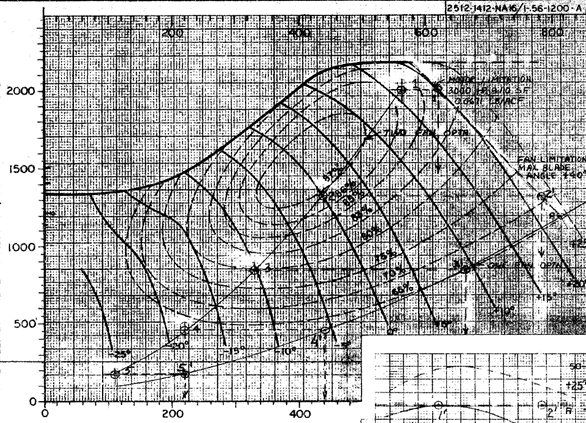
And this is the image after applying ImageAdjust[image00, {0.5, 0., 0.3} ]. Note that the heavy black lines are much more prominent.
This was the first attempt to reverse this operation, using ImageAdjust[imageAdj01, {0, -0.2, 1} ]

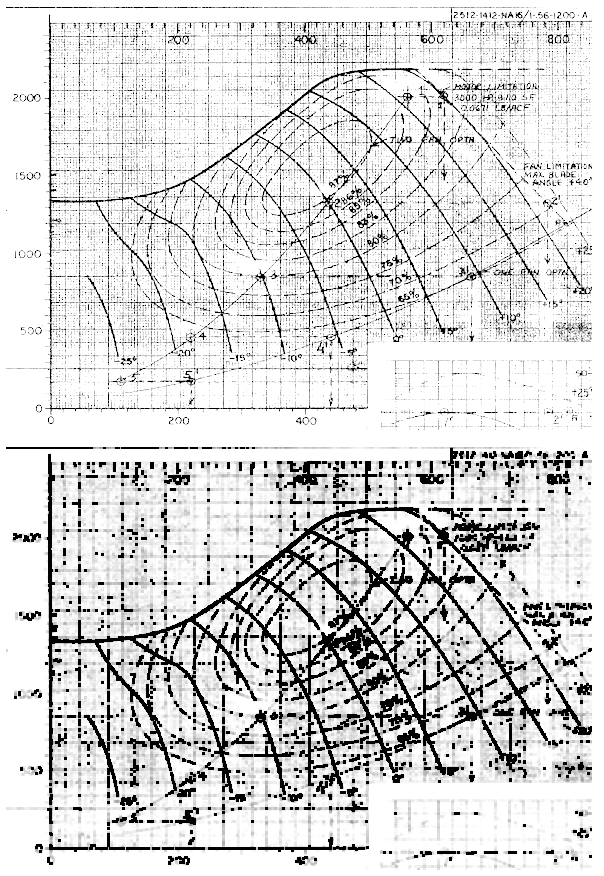
This was the second attempt, using ImageAdjust[imageAdj01, {1, -0.35, 1} ]
![ImageAdjust[imageAdj01, {1, -0.35, 1} ]](https://i.sstatic.net/clqqM.png)
After writing all of this, am now considering putting the {c,b,gamma} under the user's control. Please suggest alternatives to consider.


![result from applying ImageAdjust[image00, {0.5, 0., 0.3} ]](https://i.sstatic.net/8ePLW.png)
