0
$\begingroup$

Let $x\sim N(\mu,\sigma^2)$ and $y=\max\{e^{x-1}-\kappa,0\}$. How to get and plot the pdf of y? In particular, there will be a probability mass at $y=0$, which is a nondifferentiable point. I tried

pdfY[y_] := \[Piecewise] {
   {1/(y + κ) f[Log[y + κ] + 1], y > 0},
   {N[Integrate[f[x], {x, -10, Log[κ] + 1}]], y = 0},
   {0, y < 0}
  }

but it does not work well.

$\endgroup$
6
  • $\begingroup$ You'll need to provide values for all of the parameters: $\mu$, $\sigma$, and $\kappa$. $\endgroup$
    – JimB
    Commented Oct 8, 2020 at 3:51
  • 1
    $\begingroup$ They can be $\mu=\sigma=1$, $\kappa=3$, for instance. $\endgroup$
    – RandomBear
    Commented Oct 8, 2020 at 4:53
  • $\begingroup$ The PDF can be defined for absolutely continuous random variables only. $\endgroup$
    – user64494
    Commented Oct 9, 2020 at 5:52
  • $\begingroup$ There will be a probability mass at $y=0$. It is neither PDF nor PMF? $\endgroup$
    – RandomBear
    Commented Oct 9, 2020 at 13:41
  • $\begingroup$ Based on your question and the reasonable challenges by @user64494, I went and asked a similar question at stats.stackexchange.com/questions/491443/…. I think the answer there says that your "pdf" is neither fish nor fowl but that it is a something that can be plotted. $\endgroup$
    – JimB
    Commented Oct 12, 2020 at 3:32

2 Answers 2

3
$\begingroup$
$Version

(* "13.1.0 for Mac OS X x86 (64-bit) (June 16, 2022)" *)

Clear["Global`*"]

distY = TransformedDistribution[Max[E^(x - 1) - κ, 0],
   x \[Distributed] NormalDistribution[μ, σ]];

distY inherits the assumptions from the NormalDistribution

dpa = DistributionParameterAssumptions[distY]

(* μ ∈ Reals && σ > 0 *)

pdf[y_] = PDF[distY, y]

(* 1/2 DiracDelta[
   y + κ] (1 + 
    Erf[(1 - μ + Log[y + κ])/(Sqrt[2] σ)]) UnitStep[y] - (
 E^(-((1 - μ + Log[y + κ])^2/(2 σ^2)))
   UnitStep[y] (-1 + UnitStep[-y - κ]))/(
 Sqrt[2 π] (y + κ) σ) - 
 1/2 DiracDelta[
   y] (1 + Erf[(1 - μ + Log[κ])/(Sqrt[2] σ)]) (-1 + 
    UnitStep[-κ]) *)

Checking the total probability (this is quite slow),

AbsoluteTiming[
 Assuming[dpa, Integrate[pdf[y], {y, -Infinity, Infinity}] // Simplify]]

(* {40.1147, ConditionalExpression[1, Re[κ] >= 0 && Im[κ] == 0]} *)

Consequently, this requires κ >= 0 and

distY = TransformedDistribution[Max[E^(x - 1) - κ, 0],
   x \[Distributed] NormalDistribution[μ, σ], 
   Assumptions -> κ >= 0];

dpa = DistributionParameterAssumptions[distY]

(* κ >= 0 && μ ∈ Reals && σ > 0 *)

pdf[y_] = PDF[distY, y]

(* 1/2 DiracDelta[
   y] (1 + Erf[(1 - μ + Log[κ])/(Sqrt[2] σ)]) - (
 E^(-((1 - μ + Log[y + κ])^2/(
   2 σ^2))) (-1 + UnitStep[-y]))/(Sqrt[2 π] (y + κ) σ) *)

Assuming[dpa, Integrate[pdf[y], {y, -Infinity, Infinity}]]

(* 1 *)

This is a mixed distribution with a discrete probability for y == 0 of

pdf2[0] = 1/2*(1 + Erf[(1 - μ + Log[κ])/(Sqrt[2]*σ)]);

and a continuous probability distribution for y > 0 of

pdf2[y_] = ConditionalExpression[
  Simplify[-((-1 + UnitStep[-y])/
          (E^((1 - μ + Log[y + κ])^2/(2*σ^2))*
        (Sqrt[2*Pi]*(y + κ)*σ))), y > 0], y > 0]

(* ConditionalExpression[
   1/(E^((1 - μ + Log[y + κ])^2/(2*σ^2))*
        (Sqrt[2*Pi]*(y + κ)*σ)), y > 0] *)

Assuming[dpa,
 pdf2[0] + Integrate[pdf2[y], {y, 0, Infinity}] //
  FullSimplify]

(* 1 *)

Plotting,

μ = 1; σ = 1; κ = 3;

Show[
 Plot[pdf2[y], {y, -1/2, 5}],
 DiscretePlot[pdf2[y], {y, 0, 0},
  PlotStyle -> Red],
 PlotRange -> All,
 Frame -> True,
 Axes -> False]
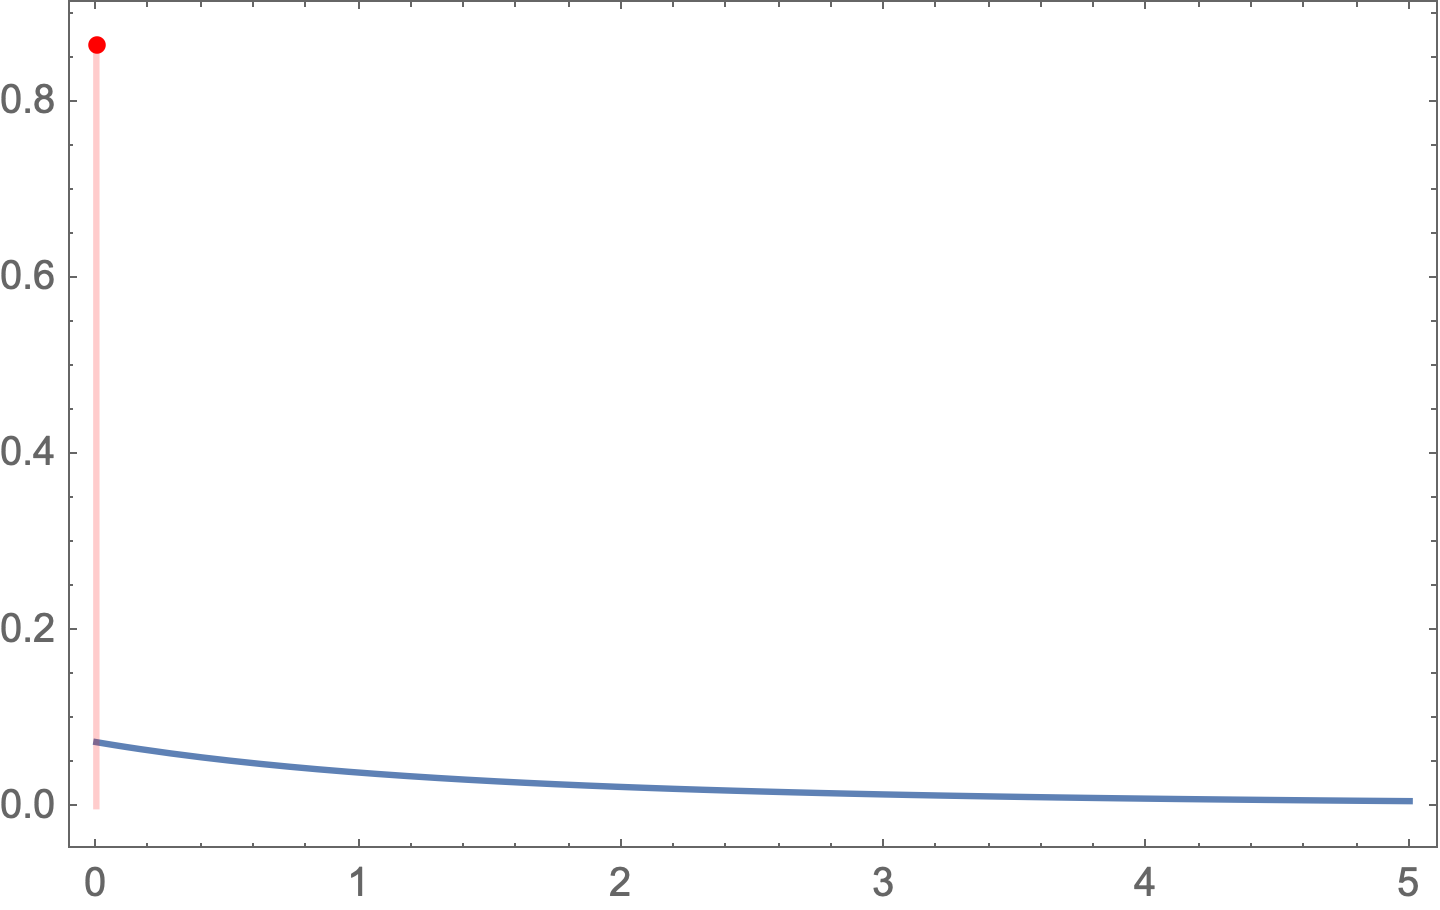
enter image description here

$\endgroup$
2
  • $\begingroup$ Don't you repeat the answer of @AsukaMinato in other formulas? See the comments to it. $\endgroup$
    – user64494
    Commented Jul 4, 2022 at 8:51
  • $\begingroup$ @user64494 - Previous answer did not include the required assumption that kappa >= 0 without which the distribution is not valid. Expressions after that additional assumption are simpler. Also, the question fundamentally was about plotting ("How to plot this pdf") which was not previously done. Mixed distributions (hybrids of discrete and continuous distributions) occur in the real world (e.g., analysis of meteor burst communications). I recall a book by Papoulis back in the early 1970s on "Probability, Random Variables and Stochastic Processes" that covered them. Or look on the internet. $\endgroup$
    – Bob Hanlon
    Commented Jul 4, 2022 at 13:47
0
$\begingroup$
TransformedDistribution[Max[E^(x-1)-κ,0],x\[Distributed] NormalDistribution[μ,σ]]//PDF[#,y]&
1/2 DiracDelta[y+κ] (1+Erf[(1-μ+Log[y+κ])/(Sqrt[2] σ)]) (-1+UnitStep[-y]) (UnitStep[-y] (-1+UnitStep[-κ])-UnitStep[-κ])-DiracDelta[y] (1+Erf[(1-μ+Log[κ])/(Sqrt[2] σ)]) (-1+UnitStep[-κ])-(E^(-((1-μ+Log[y+κ])^2/(2 σ^2))) (-1+UnitStep[-y]) (1+UnitStep[-y] (-1+UnitStep[-y-κ]) (-1+UnitStep[-κ])-UnitStep[-y-κ] UnitStep[-κ]))/(Sqrt[2 π] (y+κ) σ)

then you can plot it.

$\endgroup$
10
  • $\begingroup$ This result makes no sense in traditional math since the integral for CDF through PDF makes no sense. The PDF exists only for absolutely continuous distributions (see encyclopediaofmath.org/wiki/Continuous_distribution and en.wikipedia.org/wiki/Probability_density_function ). Such approach leads to bugs e.g. as in mapleprimes.com/posts/207769-Bug-In-Probability. In order to calculate the mean and so on the Riemann-Stielttjes integral is used. $\endgroup$
    – user64494
    Commented Oct 8, 2020 at 23:40
  • $\begingroup$ In this case it's simpler to plot the CDF as it is defined everywhere. However, there's no reason not to plot the PDF where the random variable is continuous. In this case one would likely put a dot maybe at (0,0) and note that there's a probability mass of $\frac{1}{2} \left(\text{erf}\left(\frac{\log (\kappa )-\mu +1}{\sqrt{2} \sigma }\right)+1\right)$ at $y=0$ where $\kappa>0$. $\endgroup$
    – JimB
    Commented Oct 9, 2020 at 4:42
  • $\begingroup$ @JimB: Can you ground "However, there's no reason not to plot the PDF where the random variable is continuous"? I prefer arguments over empty words. $\endgroup$
    – user64494
    Commented Oct 9, 2020 at 5:22
  • $\begingroup$ Sorry, I was way too loose with my words. The PDF will exist at any point where the CDF is differentiable. And the PDF does not have to exist at every point to disallow the plotting of the PDF at the points where it does exist. In the OP's example, suppose the $\kappa$ is very small resulting in a very small probability mass at 0 but plotting the PDF where the PDF exists will still give an appropriate picture of the distribution of that random variable. However, I am unaware of a standard way to display the probability mass in such a situation other than including an explanatory note. $\endgroup$
    – JimB
    Commented Oct 9, 2020 at 16:23
  • $\begingroup$ I was wondering how is the "density function" defined in such cases where there is a probability mass at a point and the CDF is differentiable at other points? $\endgroup$
    – RandomBear
    Commented Oct 11, 2020 at 4:26

Your Answer

By clicking “Post Your Answer”, you agree to our terms of service and acknowledge you have read our privacy policy.

Not the answer you're looking for? Browse other questions tagged or ask your own question.