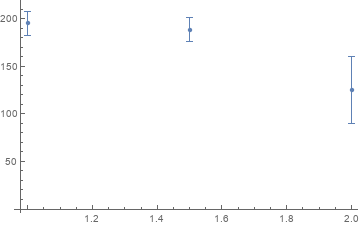
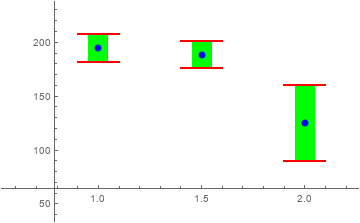
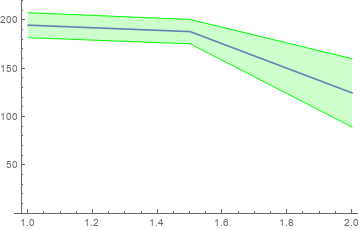
Suppose I have the following data with co-ordinates: {{1,190},{1,200},{1,210},{1,180},{1.5,175},{1.5,200},{1.5,190},{2,100},{2,150}}
How do I make a listplot of this data set, by taking the mean of the y-values for a particular x-value and then plotting an error bar. Since this is a small data set, I can evaluate mean and error easily, but what of there is a large data set, is there some way to automate the process?


