2
$\begingroup$

I have a list of data points where there can be multiple y values for a given x value, e.g., {{0, 4}, {1, 2}, {1, 3}, {2, 3}}. I would like to

  • Take the mean of the y values for each x value. Get a list of unique value pairs.
  • Then I would like to plot the unique set of x,y values.
  • Then smooth the curve
  • Then fit the curve with a function.

Is there a simple way to do this? Thanks!

$\endgroup$

1 Answer 1

3
$\begingroup$

One possibility is to use GroupBy:

assoc = GroupBy[{{0,4},{1,2},{1,3},{2,3}},First->Last,Mean]

<|0 -> 4, 1 -> 5/2, 2 -> 3|>

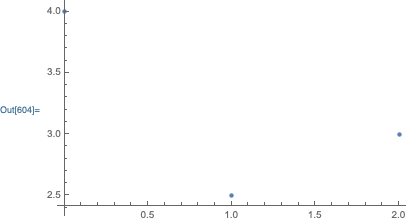
You can actually plot this association directly:

ListPlot[assoc]

enter image description here

But you might want to convert this to list of pairs:

KeyValueMap[List] @ assoc

{{0, 4}, {1, 5/2}, {2, 3}}

$\endgroup$

Your Answer

By clicking “Post Your Answer”, you agree to our terms of service and acknowledge you have read our privacy policy.

Not the answer you're looking for? Browse other questions tagged or ask your own question.