4
$\begingroup$

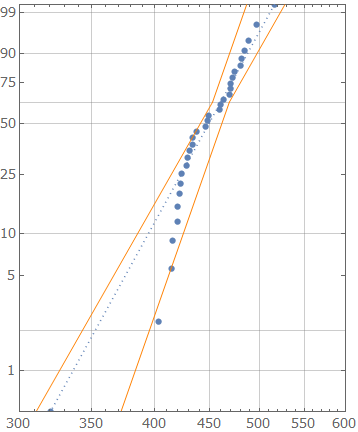
The following picture shows how I make a Weibull Graph to visualize the strength of samples.

Weibull Plot

The code and the needed data are below. In the Epilog of ProbabilityScalePlot I am plotting the confidence intervals for the data. I am doing this with 4 different HalfLines.

halflines={HalfLine[{6.11461, 0}, {-1, -14.1021}], 
 HalfLine[{6.11461, 0}, {1, 22.9597}], 
 HalfLine[{6.15032, 0}, {1, 14.1021}], 
 HalfLine[{6.15032, 0}, {-1, -22.9597}]}

strength={422.918, 488.943, 436.838, 420.08, 481.187, 430.53, 433.959, \
414.308, 468.762, 470.08, 459.893, 428.151, 423.193, 421.472, \
484.492, 463.508, 428.949, 497.333, 470.477, 402.887, 471.617, \
433.492, 415.18, 420.383, 474.359, 447.246, 445.556, 480.03, 459.678, \
448.732}

ProbabilityScalePlot[strength, "Weibull", AspectRatio -> 1.25, 
 PlotRange -> {{300, 600}, {0.5, 99.5}},
 GridLines -> {Range[300, 600, 50], {0.1, 1, 10, 50, 63, 2, 90, 99}},
 Epilog -> {Orange, halflines}]

I would like to make a Filling between the four HalfLines with low Opacity for a nicer presentation. Thanks in advance!

$\endgroup$

2 Answers 2

5
$\begingroup$
psp = ProbabilityScalePlot[strength, "Weibull", AspectRatio -> 1.25, 
   PlotRange -> {{300, 600}, {0.5, 99.5}}, 
   GridLines -> {Range[300, 600, 50], {0.1, 1, 10, 50, 63, 2, 90,  99}}, 
   Epilog -> {Orange, halflines}];

prange = PlotRange[psp] + {{-1, 1}, {-1, 1}};

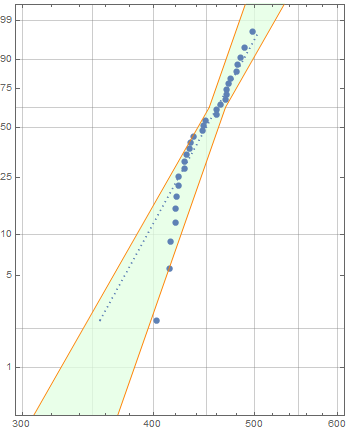
1. Construct two ConicHullRegions from the two pairs of halflines and take the RegionIntersection of their RegionDifferences from a rectangle:

chrs = ConicHullRegion[{#[[1, 1]]}, {#[[1, 2]], #[[2, 2]]}] & /@ 
   Partition[halflines, 2];

regint = RegionIntersection @@ 
   (RegionDifference[Rectangle @@ Transpose[prange], 
       DiscretizeGraphics @ Graphics[#, PlotRange -> prange]] & /@ chrs);

Show[psp, 
 Prolog -> {Show[regint][[1]] /. p_Polygon :> 
    {EdgeForm[], Opacity[.75, LightGreen], p}}]

enter image description here

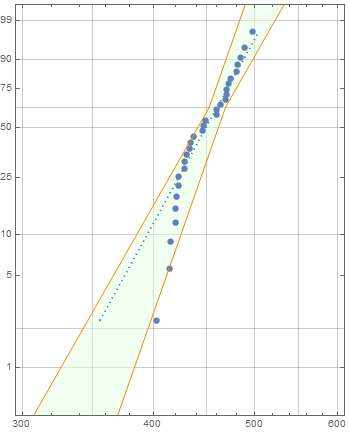
2. Construct a Piecewise function using RegionMember + RegionUnion for each of the two pairs of halflines and Plot them with option Filling:

toPiecewise = FullSimplify[RegionMember[RegionUnion @@ #][{x, y}], {x, y} ∈  Reals] /.
    And[a_, b_] :> {y /. Solve[b, y][[1]], a} /. Or -> (Piecewise[{##}] &) &;

g1[x_] := Evaluate @ toPiecewise @ halflines[[;; 2]]
g2[x_] := Evaluate @ toPiecewise @ halflines[[3 ;;]]

Show[psp, Prolog -> First @ Plot[{g1[x], g2[x]}, {x, ## & @@ prange[[1]]}, 
    PlotStyle -> None, Filling -> {1 -> {{2}, Opacity[.5, LightGreen]}}, 
    Exclusions -> None]]

enter image description here

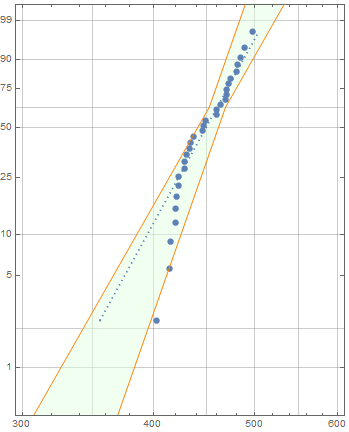
3. Process halflines to get the line coordinates and re-order them to use with Polygon or FilledCurve:

lcoords = {#, Reverse @ #2} & @@ (SortBy[Last][MeshCoordinates @
   DiscretizeGraphics[Graphics @ #, PlotRange -> prange]] & /@ Partition[halflines, 2]);

Show[psp, Prolog -> {EdgeForm[], Opacity[.5, LightGreen], Polygon[Join @@lcoords]}]

enter image description here

Show[psp,  Prolog -> {EdgeForm[], Opacity[.5, LightGreen], FilledCurve[Line/@ lcoords]}]

same picture

$\endgroup$
7
$\begingroup$
Clear["`*"];
strength = {422.918, 488.943, 436.838, 420.08, 481.187, 430.53, 
   433.959, 414.308, 468.762, 470.08, 459.893, 428.151, 423.193, 
   421.472, 484.492, 463.508, 428.949, 497.333, 470.477, 402.887, 
   471.617, 433.492, 415.18, 420.383, 474.359, 447.246, 445.556, 
   480.03, 459.678, 448.732};
fig = ProbabilityScalePlot[strength, "Weibull", AspectRatio -> 1.25, 
   PlotRange -> {{300, 600}, {0.5, 99.5}}, 
   GridLines -> {Range[300, 600, 50], {0.1, 1, 10, 50, 63, 2, 90, 
      99}}];
a0 = {6.11461, 0};
a1 = {-1, -14.1021};
a2 = {1, 22.9597};
b0 = {6.15032, 0};
b1 = {1, 14.1021};
b2 = {-1, -22.9597};
reg = RegionIntersection[RegionUnion[HalfPlane[a0, a1, {1, 0}],
    HalfPlane[a0, a2, {1, 0}]],
   RegionUnion[HalfPlane[b0, b1, {-1, 0}],
    HalfPlane[b0, b2, {-1, 0}]]];
Show[fig, 
 RegionPlot[reg, BoundaryStyle -> Orange, 
  PlotStyle -> Directive[Yellow, Opacity[0.1]]]]
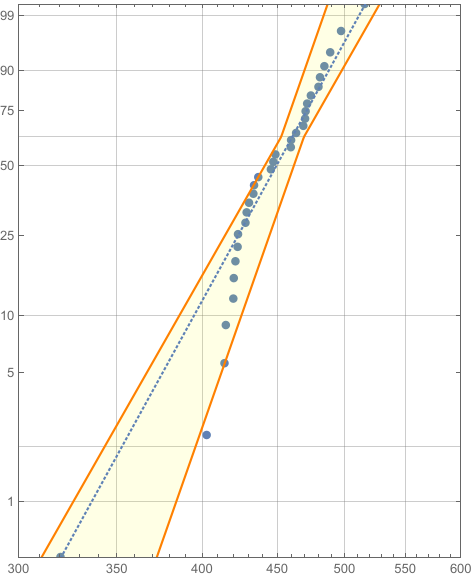
enter image description here

Updated

We can construct a region by deformate a parametric curves {f[y],y} to another parametric curves {g[y],y} by (1-t)*{f[y],y} + t*{g[y],y} as display as below:

Clear["`*"];
f[y_] = Sin[y];
g[y_] = Sqrt[1 + y^2];
ParametricPlot[{{f[y], y}, {g[y], y}}, {y, -2 Pi, 2 Pi}]
ParametricPlot[(1 - t)*{f[y], y} + t*{g[y], y}, {t, 0, 
  1}, {y, -2 Pi, 2 Pi}, MeshFunctions -> (#3 &), Mesh -> 10]
GraphicsRow[{%%, %}]
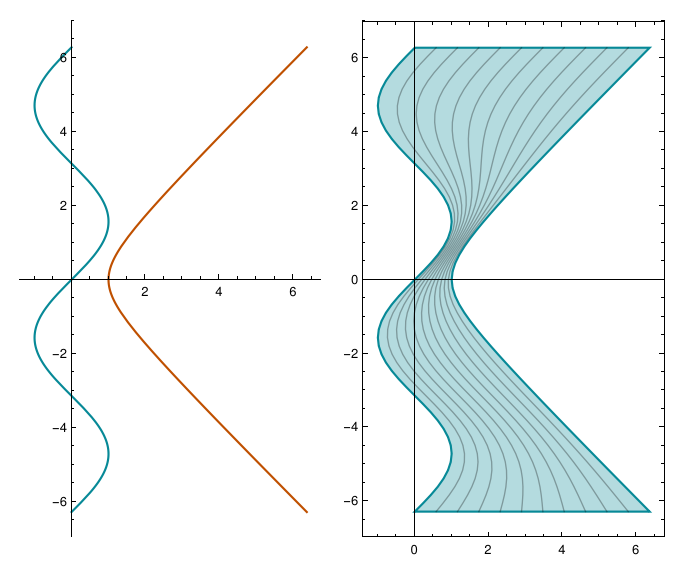
enter image description here

Clear["`*"];
strength = {422.918, 488.943, 436.838, 420.08, 481.187, 430.53, 
   433.959, 414.308, 468.762, 470.08, 459.893, 428.151, 423.193, 
   421.472, 484.492, 463.508, 428.949, 497.333, 470.477, 402.887, 
   471.617, 433.492, 415.18, 420.383, 474.359, 447.246, 445.556, 
   480.03, 459.678, 448.732};
fig = ProbabilityScalePlot[strength, "Weibull", AspectRatio -> 1.25, 
   PlotRange -> {{300, 600}, {0.5, 99.5}}, 
   GridLines -> {Range[300, 600, 50], {0.1, 1, 10, 50, 63, 2, 90, 
      99}}];
x1 = 6.11461;
x2 = 6.15032;
k1 = 14.1021;
k2 = 22.9597;
f[y_] := Piecewise[{{x1 + y/k2, y >= 0}, {x1 + y/k1, y < 0}}];
g[y_] := Piecewise[{{x2 + y/k1, y >= 0}, {x2 + y/k2, y < 0}}];
lines = ParametricPlot[{{f[y], y}, {g[y], y}}, {y, -6, 2}, 
   PlotStyle -> {{Thick, Orange}, {Thick, Red}}];
reg = ParametricPlot[{t*f[y] + (1 - t)*g[y], y}, {t, 0, 1}, {y, -6, 
    2}, PlotPoints -> 100, 
   PlotStyle -> Directive[Green, Opacity[0.1]]];
Show[fig, reg, lines]
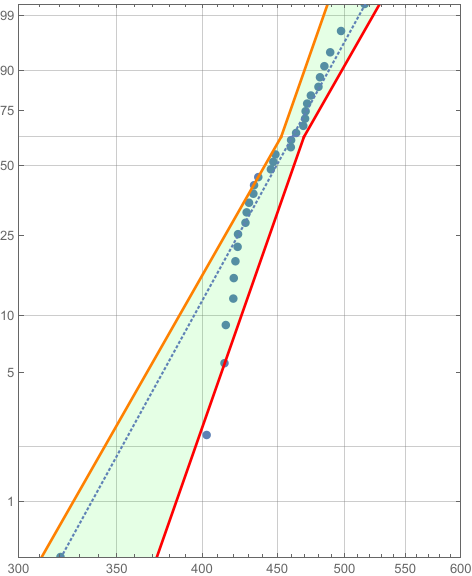
enter image description here

$\endgroup$
1
  • $\begingroup$ I want to do a comparable plot. The answers here are good to make one. I am missing one step for me that is how to get the values for the curved confidence bounds? E.g. I have the standard error (from: mathematica.stackexchange.com/questions/6498/…) $\endgroup$
    – Eisbär
    Commented Feb 28, 2021 at 14:06

Your Answer

By clicking “Post Your Answer”, you agree to our terms of service and acknowledge you have read our privacy policy.

Not the answer you're looking for? Browse other questions tagged or ask your own question.