1
$\begingroup$

I try to evaluate this symbolic integral and evaluate its two series expansions according to certain variables, the plot the output providing some numerical values.

This is a relativistic rotational hollow disk. This one my thought experiments I try to figure it out. I am a hobbyist physicist


f1 = (y (-z + 
       y Cos[x]))/(((1 - (\[Omega] y)^2/h^2)^(1/2)) ((z^2 + y^2 - 
         2 z y Cos[x])^(3/2)));
f2 = Assuming[0 < z < 0.99 ymin  && 0.99 h > \[Omega] y, 
   Integrate[f1, {y, ymin, ymax}, {x, 0, 2 Pi}] // FullSimplify];
S2 = Assuming[0 < z < 0.99 ymin  && 0.99 h > \[Omega] y, 
  Series[f2, {z, 0, 3}, {\[Omega], 0, 4}] // FullSimplify]
S3 = Assuming[0 < z < 0.99 ymin  && 0.99 h > \[Omega] y, 
  Series[f2, {w, 0, 3}] // FullSimplify]
\[Omega] = 1;
w = z \[Omega]^2;
h = 1000;
ymin = 500;
ymax = 985;
Plot[f2, {w, 0, 495}]

My Question is: I takes very very long time, and I lost the hope to see result. I use the trial version of the most recent Mathematica.

Is there something wrong in this code?

------------ at Aug 28 2020 --------------

What if I try to fix z and plot versus omega provided that ymin>z>ymax. There will be divergence at z, so I tried to divide the integral to two integrals and take the limit at z to solve the improper integrations, the one that has ymin1>z>ymax1, and the other that has ymin2>z>ymax2. It didn't give me any result. Here is a trial to fix z and do series and plot with respect to omega.

f1[z_?NumericQ, \[Omega]_?NumericQ, h_?NumericQ, ymin1_?NumericQ, 
   ymax1_?NumericQ] := 
  NIntegrate[(y (-z + 
        y Cos[x]))/(((1 - (\[Omega] y)^2/h^2)^(1/2)) ((z^2 + y^2 - 
          2 z y Cos[x])^(3/2))), {y, ymin1, ymax1}, {x, 0, 2 Pi}, 
   Method -> "LocalAdaptive"];
f2[z_?NumericQ, \[Omega]_?NumericQ, h_?NumericQ, ymin2_?NumericQ, 
   ymax2_?NumericQ] := 
  NIntegrate[(y (-z + 
        y Cos[x]))/(((1 - (\[Omega] y)^2/h^2)^(1/2)) ((z^2 + y^2 - 
          2 z y Cos[x])^(3/2))), {y, ymin2, ymax2}, {x, 0, 2 Pi}, 
   Method -> "LocalAdaptive"];
f3 = f1 + f2;
L1 = Limit[f1[1, \[Omega], 1000, 0, ymx1], ymx1 -> 1, 
  Assumptions -> ymx1 < 1]
L2 = Limit[
  f2[1, \[Omega], 1000, ymn2, ymx2], {ymn2 -> 1, ymx2 -> 250}, 
  Assumptions -> ymn2 > 1 && ymx2 < 250  && \[Omega] < 4]
L3 = L1 + L2 

S1 = Series[L1, {\[Omega], 0, 4}]
S2 = Series[L2, {\[Omega], 0, 4}]
S3 = Series[(L1 + L2), {\[Omega], 0, 4}]

P1 = Plot[L1, {\[Omega], 0, 4}, AxesLabel -> {"\[Omega]", "L1"}]
P2 = Plot[L2, {\[Omega], 0, 4}, AxesLabel -> {"\[Omega]", "L2"}]
P3 = Plot[(L1 + L2), {\[Omega], 0, 4}, 
  AxesLabel -> {"\[Omega]", "L3"}]

And what if I need to get series and plot w.r.t. z also?

$\endgroup$
7
  • 1
    $\begingroup$ Also your plot range makes no sense because w = z \[Omega]^2 and f2 will have a mixture of y and z. Plot needs a single independent variable. $\endgroup$
    – flinty
    Commented Aug 19, 2020 at 9:59
  • $\begingroup$ Hi flinty, 1- what is Rubi`; role? 2- y should not be an independent variable after integration from ymin to ymax $\endgroup$ Commented Aug 19, 2020 at 10:17
  • 1
    $\begingroup$ Apologies - I was integrating wrt x. $\endgroup$
    – flinty
    Commented Aug 19, 2020 at 10:20
  • $\begingroup$ Rubi is a package for rule-based-integration which can sometimes solve integrals when Mathematica cannot. It appears that even Rubi cannot do it when integrating over both y and x. You should therefore look into numerically integrating it. $\endgroup$
    – flinty
    Commented Aug 19, 2020 at 10:23
  • $\begingroup$ @flinty Is numerical integration same but NIntegrate instead of Integrate? $\endgroup$ Commented Aug 19, 2020 at 10:34

1 Answer 1

3
$\begingroup$

It looks like you'll have to go for numerical integration as neither Mathematica nor Rubi could calculate a symbolic integral.

f2[z_?NumericQ, ω_?NumericQ, h_?NumericQ, ymin_?NumericQ, ymax_?NumericQ] := 
  NIntegrate[
    (y (-z + y Cos[x]))/(((1 - (ω y)^2/h^2)^(1/2)) ((z^2 + y^2 - 2 z y Cos[x])^(3/2)))
  , {y, ymin, ymax}, {x, 0, 2 Pi}, Method -> "LocalAdaptive"]


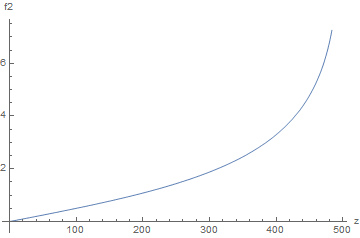
Plot[f2[z, 1.0, 1000.0, 500.0, 985.0], {z, 0, 495}, 
 AxesLabel -> {"z", "f2"}]

integral plot

$\endgroup$
4
  • $\begingroup$ Great flinty, How much time it took from you to graph? And which version of Mathematica? $\endgroup$ Commented Aug 19, 2020 at 11:25
  • 1
    $\begingroup$ @AhmedKamalKassem with Method -> "LocalAdaptive" it's much faster, around 10s, but without that it takes a long time > 1min. I'm using Windows 10 Mathematica v12.1.1.0 home. $\endgroup$
    – flinty
    Commented Aug 19, 2020 at 11:44
  • $\begingroup$ I tried the double integral, bot this time from 0 to ymax, so there is a divergence at y=z, if ymax>z>ymin, so, to avoid divergence for the improper integration I took the limit, but I don't get a result: the new code: $\endgroup$ Commented Aug 27, 2020 at 12:47
  • $\begingroup$ @fliny What if I try to fix z and plot versus omega, but z has the condition ymin>z>ymax. There will be divergence at z, so I tried to divide the integral to two integrals and take the limit at z to solve the improper integrations, the one that has ymin1>z>ymax1, and the other that has ymin2>z>ymax2. It didn't give me any result. I tried to put the code here in the comment it exceeded the number of letters allowed. $\endgroup$ Commented Aug 27, 2020 at 13:28

Your Answer

By clicking “Post Your Answer”, you agree to our terms of service and acknowledge you have read our privacy policy.

Not the answer you're looking for? Browse other questions tagged or ask your own question.