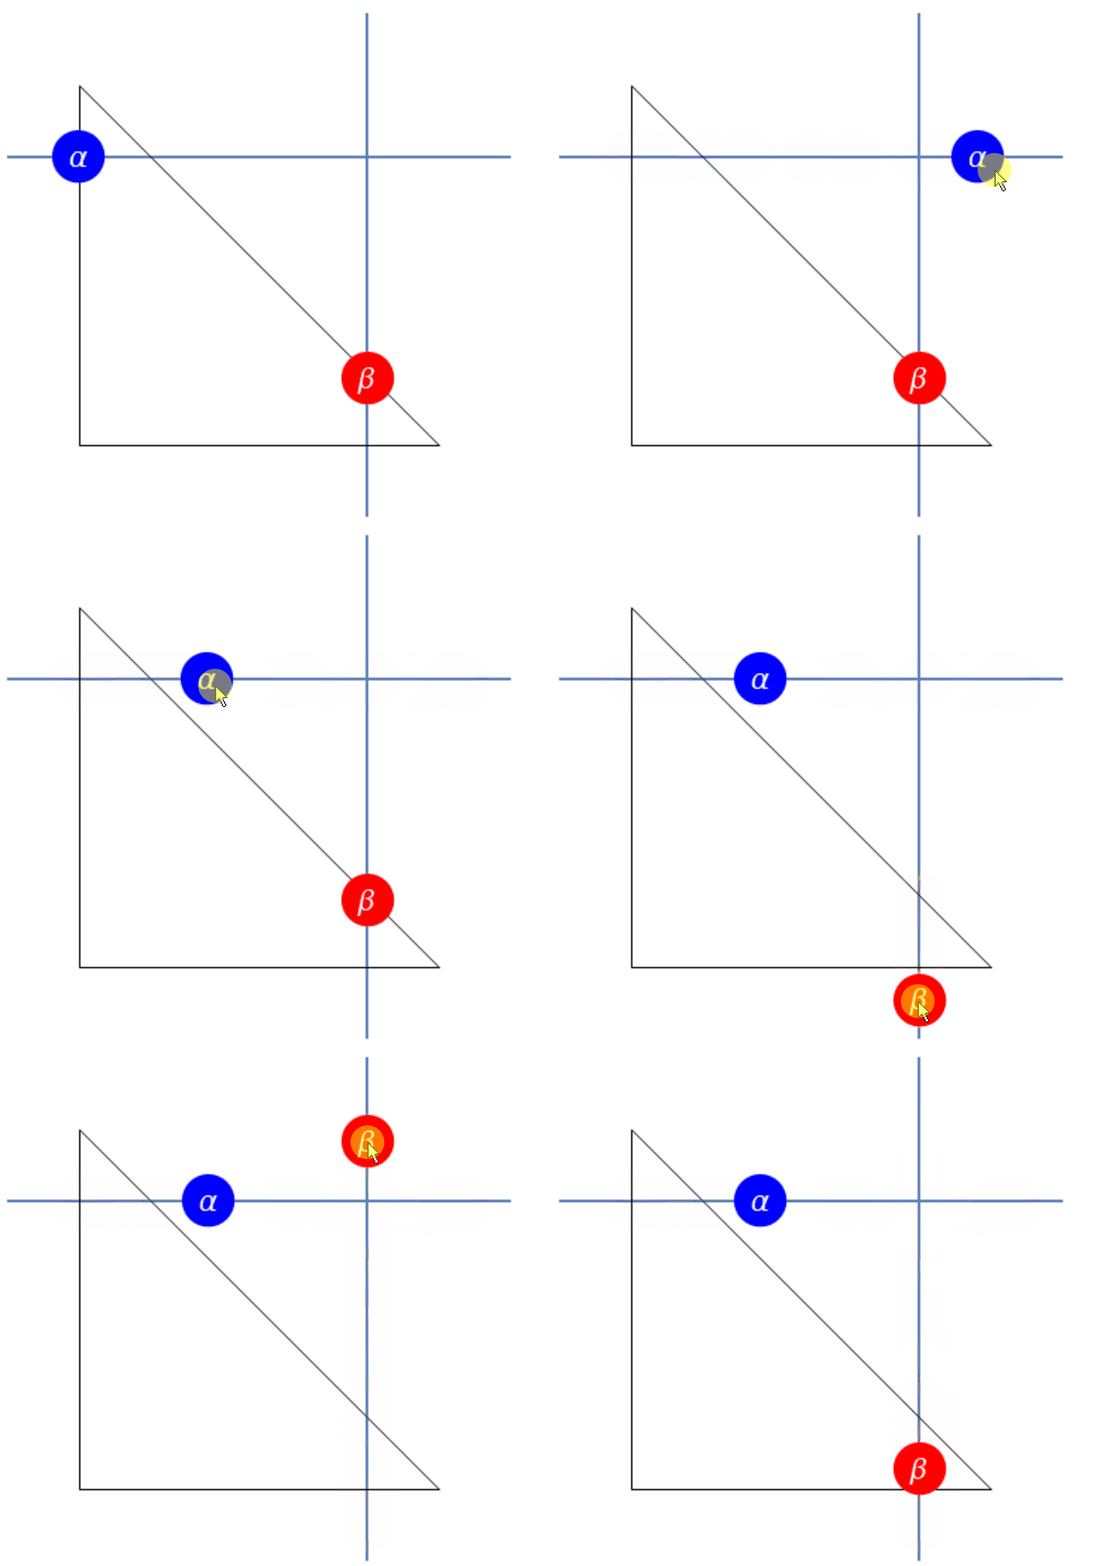
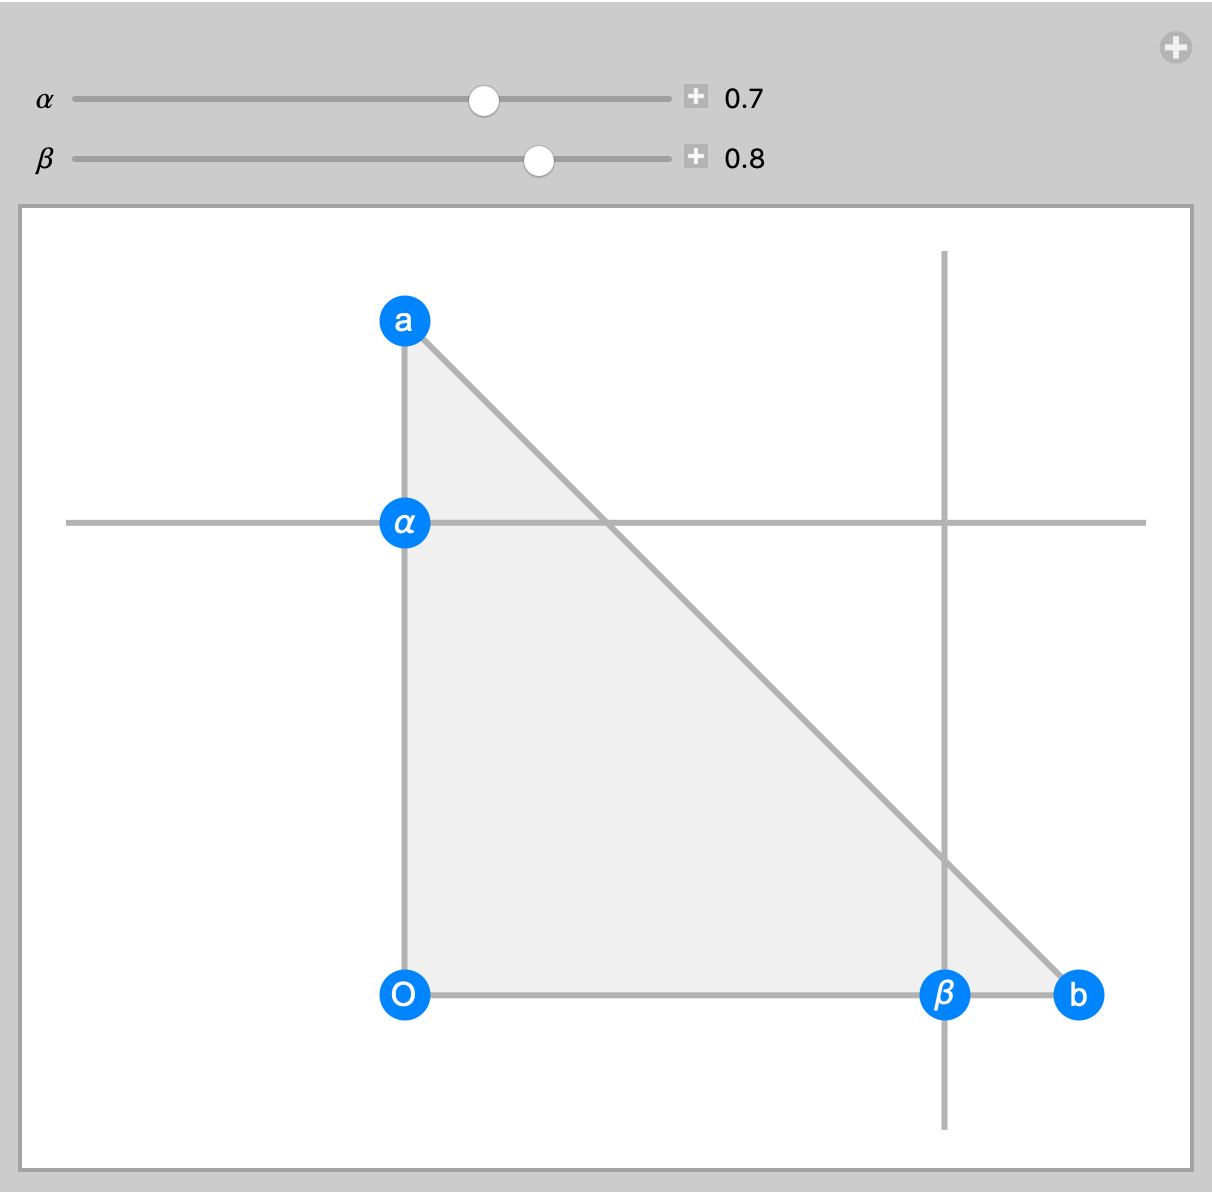
I have the following figure
Given by the Following code
pic3 := Plot[0.7 + 0*x, {x, -0.5, 1}]
pic4 := ListLinePlot[
  Thread[List[0.8 & /@ Range[0, 1], Range[-0.2, 1]]]]

pic5 := Graphics[Line[{{0, 0}, {0, 1}, {1, 0}, {0, 0}}]]
Show[pic5, pic4, pic3, PlotRange -> {{-1, 1}, {-1, 1}}]
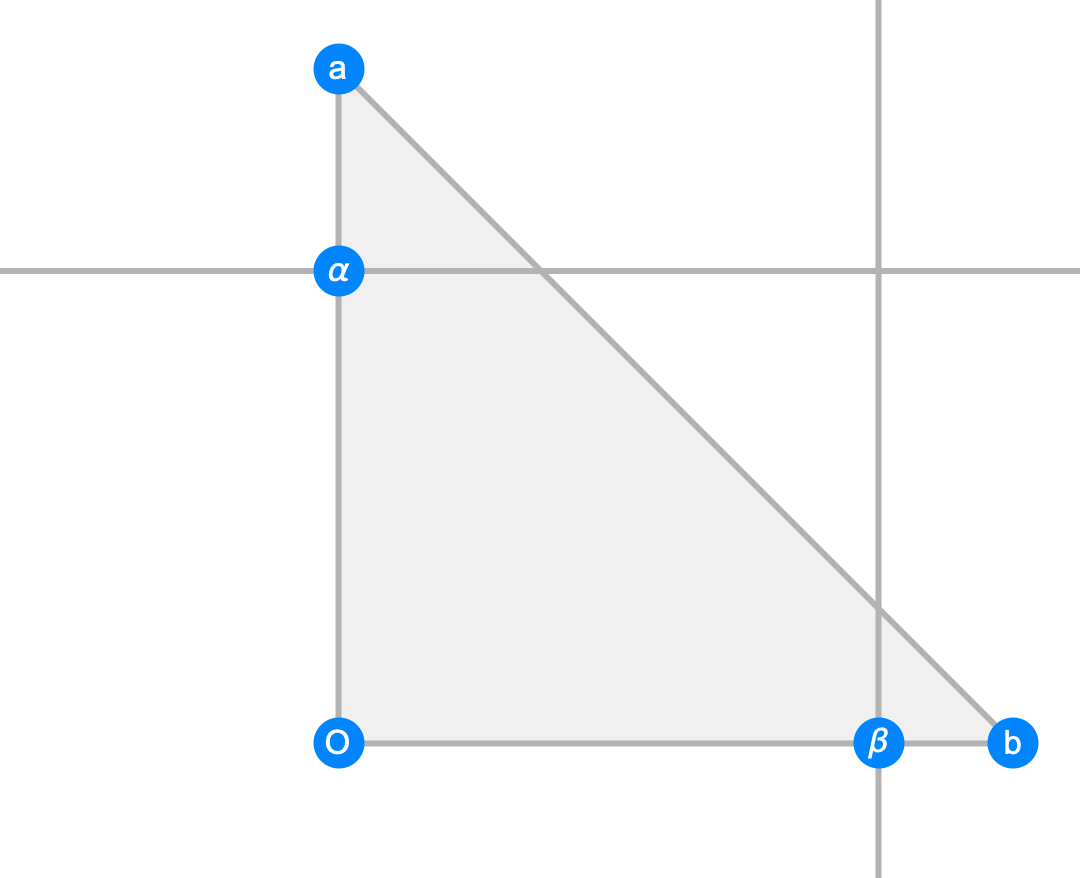
I would like to add 2 brackets one that said $\alpha$ between $(0,0)$ and the cut in $y$-axis and another that said $\beta$ between $(0,0)$ and the cut at the $x-$Axis. Is this possible ? Thanks in advance .


