With the following code:
arc = Graphics[{Arrowheads[{0, 0.04}],
    GraphicsComplex[
     Table[{0.5 + 0.7 Re[Exp[I*g]], 0.5 + 0.7 Im[Exp[I*g]]}, {g,
       Subdivide[0, Pi/2 - Pi/6, 100]}], Arrow[Range[101]]]}];
sensor = Graphics[
   Circle[{0.5 + 1. Cos[Pi/3], 0.5 + 1. Sin[Pi/3]}, 0.03]];
sensorM =
  Graphics[Style[Text["M" , {1, 1.47}], FontSize -> 18,
    FontFamily -> "Latin Modern Roman"]];
Omega0 = Graphics[
   Style[Text[
     "\!\(\*SuperscriptBox[\(\[CapitalOmega]\), \(0\)]\)" , {0.2,
      1.27}], FontSize -> 20, FontFamily -> "Latin Modern Roman"]];
OmegaE = Graphics[
   Style[Text[
     "\!\(\*SuperscriptBox[\(\[CapitalOmega]\), \(e\)]\)" , {0.8, \
-0.27}], FontSize -> 20, FontFamily -> "Latin Modern Roman"]];
theta = Graphics[
   Style[Text["\[Theta]" , {1.2, 0.77}], FontSize -> 20,
    FontFamily -> "Latin Modern Roman"]];
rpolar = Graphics[
   Style[Text["r" , {0.85, 1.17}], FontSize -> 20,
    FontFamily -> "Latin Modern Roman"]];
er = Graphics[
   Arrow[{{0.5 + 1. Cos[Pi/3],
      0.5 + 1. Sin[Pi/3]}, {0.5 + 1. Cos[Pi/3] + 0.3 Cos[Pi/3],
      0.5 + 1. Sin[Pi/3] + 0.3 Sin[Pi/3]}}]];
etheta = Graphics[
   Arrow[{{0.5 + 1. Cos[Pi/3],
      0.5 + 1. Sin[Pi/3]}, {0.5 + 1. Cos[Pi/3] - 0.3 Sin[Pi/3],
      0.5 + 1. Sin[Pi/3] + 0.3 Cos[Pi/3]}}]];
erUnit = Graphics[
   Style[Text[Subscript[OverHat[e], r], {1.25, 1.55}], FontSize -> 20,
     FontFamily -> "Latin Modern Roman"]];
erthetaUnit =
  Graphics[Style[Text[Subscript[OverHat[e], \[Theta]], {0.75, 1.65}],
    FontSize -> 20, FontFamily -> "Latin Modern Roman"]];
h = Graphics[
   Line[{{{-1, 1/2}, {0, 0}, {-1, -1/2}}, {{0, 1/2}, {1,
       0}, {0, -1/2}}, {{1, 1/2}, {2, 0}, {1, -1/2}}}]];
propVector =
  Graphics[{Arrowheads[{{Automatic, Automatic, h}}],
    Arrow[{{-1., 0.5}, {-0.5, 0.5}}]}];
lines = Graphics[{Line[{{-0.8, 0.2}, {-0.8, 0.8}}],
    Line[{{-0.75, 0.2}, {-0.75, 0.8}}]}];
pinc = Graphics[
   Style[Text["\!\(\*SubscriptBox[\(p\), \(inc\)]\)", {-0.95, 0.75}],
    FontSize -> 20, FontFamily -> "Latin Modern Roman"]];
Show[{Graphics[{Dotted, Circle[{0.5, 0.5}, 1]}],
  Graphics[Circle[{0.5, 0.5}, 0.5]], arc, sensor, sensorM, Omega0,
  OmegaE, theta, rpolar, er, etheta, erUnit, lines, propVector, pinc,
  erthetaUnit,
  Graphics[{DotDashed, Arrowheads[0.04],
    Arrow[{{0.5, 0.5}, {0.5 + 1. Cos[Pi/3], 0.5 + 1. Sin[Pi/3]}}]}]},
 Axes -> True, AxesOrigin -> {0.5, 0.5},
 AxesLabel -> {Style["x", FontSize -> 20,
    FontFamily -> "Latin Modern Roman", FontColor -> Black],
   Style["y", FontSize -> 20, FontFamily -> "Latin Modern Roman",
    FontColor -> Black]}, AxesStyle -> Arrowheads[{0, 0.05}],
 PlotRange -> All]
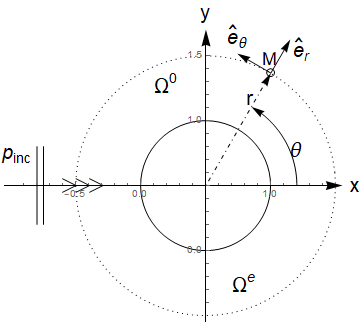
I produced the following image
Eventually, I will get rid of AxesTicks, but I leave them for reference. I am puzzled how I can modify the Axes Range. For instance, the x-axis should range from -0.3 to 1.3 and similarly for the y-axis. The AxesLabel should be moved accordingly but the rest of the figure should not be modified.
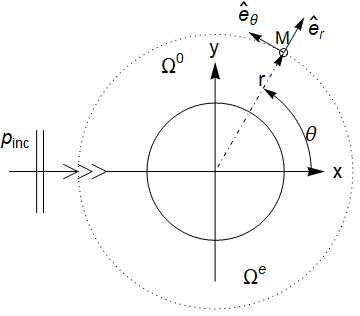
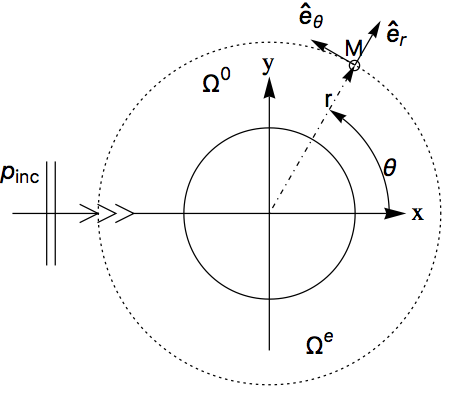
Thanks in advance!


PlotRange -> {{-.3, 1.3}, {-.3, 1.3}}, and add the optionImagePadding -> Scaled[.1]? $\endgroup$Scaledto 0.15 we get the whole figure but minimized I have to addImageSize -> 400to get a bigger Figure but I do not know if this is the proper technique. $\endgroup$