0
$\begingroup$

I want to confine the codomain of my plot. For example, I want to draw y=f(x) only when 3x<y<7x+3. If not, want to draw y=0.

Is it possible in Mathematica plot?

$\endgroup$
6
  • 1
    $\begingroup$ Just as suggested in your previous question, use Piecewise. $\endgroup$
    – xzczd
    Commented Jul 5, 2020 at 6:50
  • $\begingroup$ Thanks, but how can I use Piecewise in this case? In my previous question, I confined the domain, not codomain. $\endgroup$
    – Chris
    Commented Jul 5, 2020 at 6:55
  • $\begingroup$ do you have an example of f(x)? $\endgroup$
    – Nasser
    Commented Jul 5, 2020 at 6:58
  • $\begingroup$ Just confine the codomain as you confined the domain. $\endgroup$
    – xzczd
    Commented Jul 5, 2020 at 6:59
  • $\begingroup$ It's a bit complex, but let me give a simplified example. y = (1/2) * (2H-2L+2*sqrt(H(H-L)(1-a))). And want to draw a graph only when y1< y <y2 (y1 and y2 are function of H, L, and a). $\endgroup$
    – Chris
    Commented Jul 5, 2020 at 7:03

2 Answers 2

4
$\begingroup$

May be

Clear["Global`*"]
f[x_?NumericQ] := x + x^2; (*made one up, since none was given *)
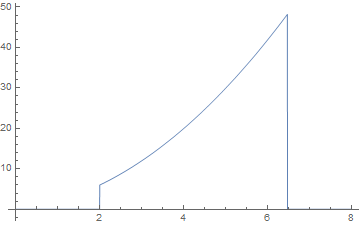
g[x_?NumericQ] := Piecewise[{{f[x], 3 x < f[x] < 7 x + 3}, {0, True}}];
Plot[g[x], {x, 0, 8}, PlotRange -> All]
Mathematica graphics

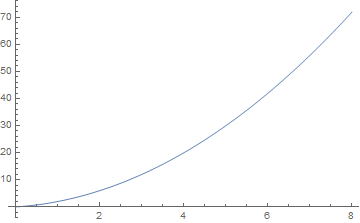
This is f[x]

 Plot[f[x], {x, 0, 8}]

Mathematica graphics

$\endgroup$
9
  • $\begingroup$ It works very well even for the very complex multi-variate functions. Thank you so much! $\endgroup$
    – Chris
    Commented Jul 5, 2020 at 7:23
  • $\begingroup$ BTW, what ?NumericQ stands for? $\endgroup$
    – Chris
    Commented Jul 5, 2020 at 7:24
  • $\begingroup$ @Chris it is to insure these functions are called only for numerical input, by the Plot command that is. Since these only make sense with x is numerical, due to the comparison being made. $\endgroup$
    – Nasser
    Commented Jul 5, 2020 at 7:25
  • $\begingroup$ One can also use ConditionalExpression[f[x], 3 x < f[x] < 7 x + 3] to avoid the extension by zero that one gets with Piecewise. $\endgroup$
    – Michael E2
    Commented Jul 5, 2020 at 11:50
  • $\begingroup$ @Nasser Thank you so much! $\endgroup$
    – Chris
    Commented Jul 5, 2020 at 13:59
1
$\begingroup$

PlotRange -> {{<domain>}, {<codomain>}} is the way to set the codomain in its normal meaning.

But the OP has in mind restricting the region that is plotted, and that task can be handled with RegionFunction.

Plot[10 (x - 10) Sin[x], {x, -2, 80},
 RegionFunction -> Function[{x, y}, 3 x < y < 7 x + 3]]

enter image description here

$\endgroup$

Your Answer

By clicking “Post Your Answer”, you agree to our terms of service and acknowledge you have read our privacy policy.

Not the answer you're looking for? Browse other questions tagged or ask your own question.