Fixed typo
Source Link
Michael E2
  • 244.8k
  • 18
  • 351
  • 774

PlotRange -> {{<domain>}, {<codomain>}} is the way to set the codomain in its normal meaning.

But the OP has in mind restricting the region that is plotted, and that task can be handled with RegionFunction.

Plot[10 (x - 10) Sin[x], {x, -2, 80},
 RegionFunction -> Function[{x, y}, 3 x < y < 7 x + 3]]

enter image description here

PlotRange is the way to set the codomain in its normal meaning.

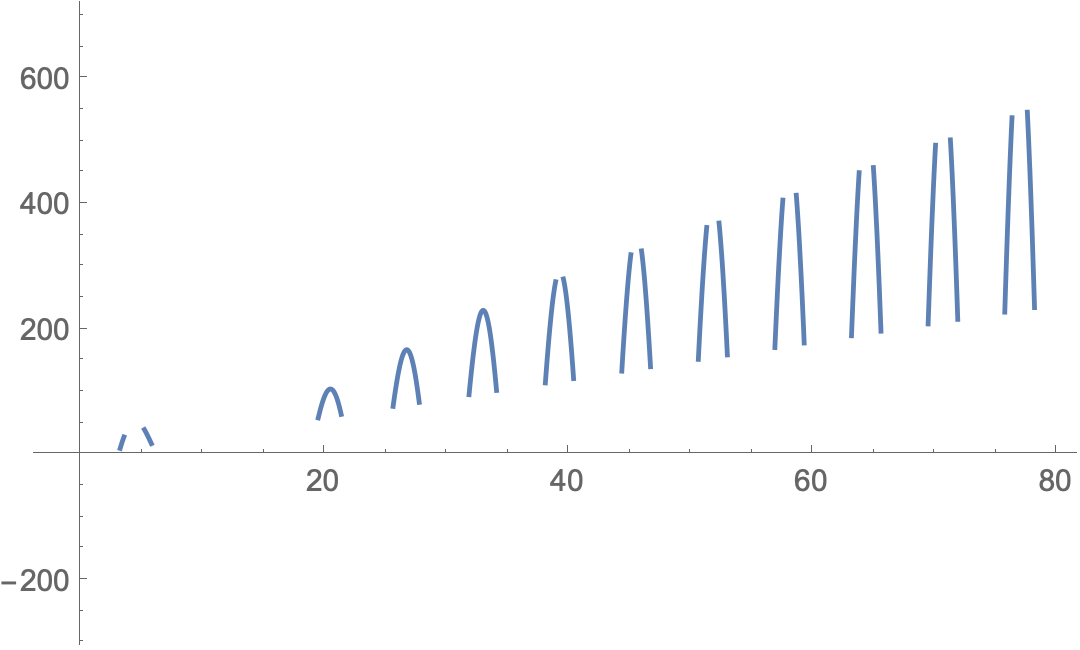
But the OP has in mind restricting the region that plotted, and that can be handled with RegionFunction.

Plot[10 (x - 10) Sin[x], {x, -2, 80},
 RegionFunction -> Function[{x, y}, 3 x < y < 7 x + 3]]
enter image description here

PlotRange -> {{<domain>}, {<codomain>}} is the way to set the codomain in its normal meaning.

But the OP has in mind restricting the region that is plotted, and that task can be handled with RegionFunction.

Plot[10 (x - 10) Sin[x], {x, -2, 80},
 RegionFunction -> Function[{x, y}, 3 x < y < 7 x + 3]]

enter image description here

Source Link
Michael E2
  • 244.8k
  • 18
  • 351
  • 774

PlotRange is the way to set the codomain in its normal meaning.

But the OP has in mind restricting the region that plotted, and that can be handled with RegionFunction.

Plot[10 (x - 10) Sin[x], {x, -2, 80},
 RegionFunction -> Function[{x, y}, 3 x < y < 7 x + 3]]

enter image description here