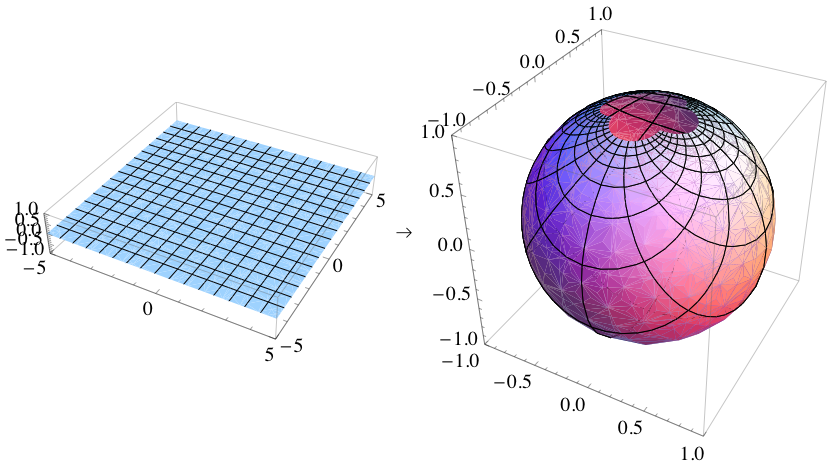
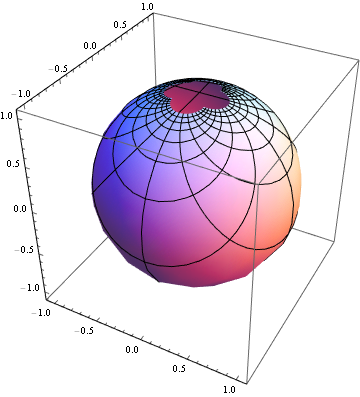
I really want to know how to plot the Cartesian grid lines on a 2D plane onto a sphere in the context of stereographic projection. I found this image showing what I want to plot. Can anyone help me to obtain the code to plot this sphere using SphericalPlot3D and MeshFunctions?
1 Answer
$\begingroup$
$\endgroup$
This looks like a stereographic projection to me:
stereo[{x_, y_}] := {
  (2 x)/(1 + x^2 + y^2),
  (2 y)/(1 + x^2 + y^2),
  (-1 + x^2 + y^2)/(1 + x^2 + y^2)}
ParametricPlot3D[
 stereo[{x, y}], {x, -2 π, 2 π}, {y, -2 π, 2 π},
 PlotRange -> Full, PlotTheme -> "Classic"]


