6
$\begingroup$

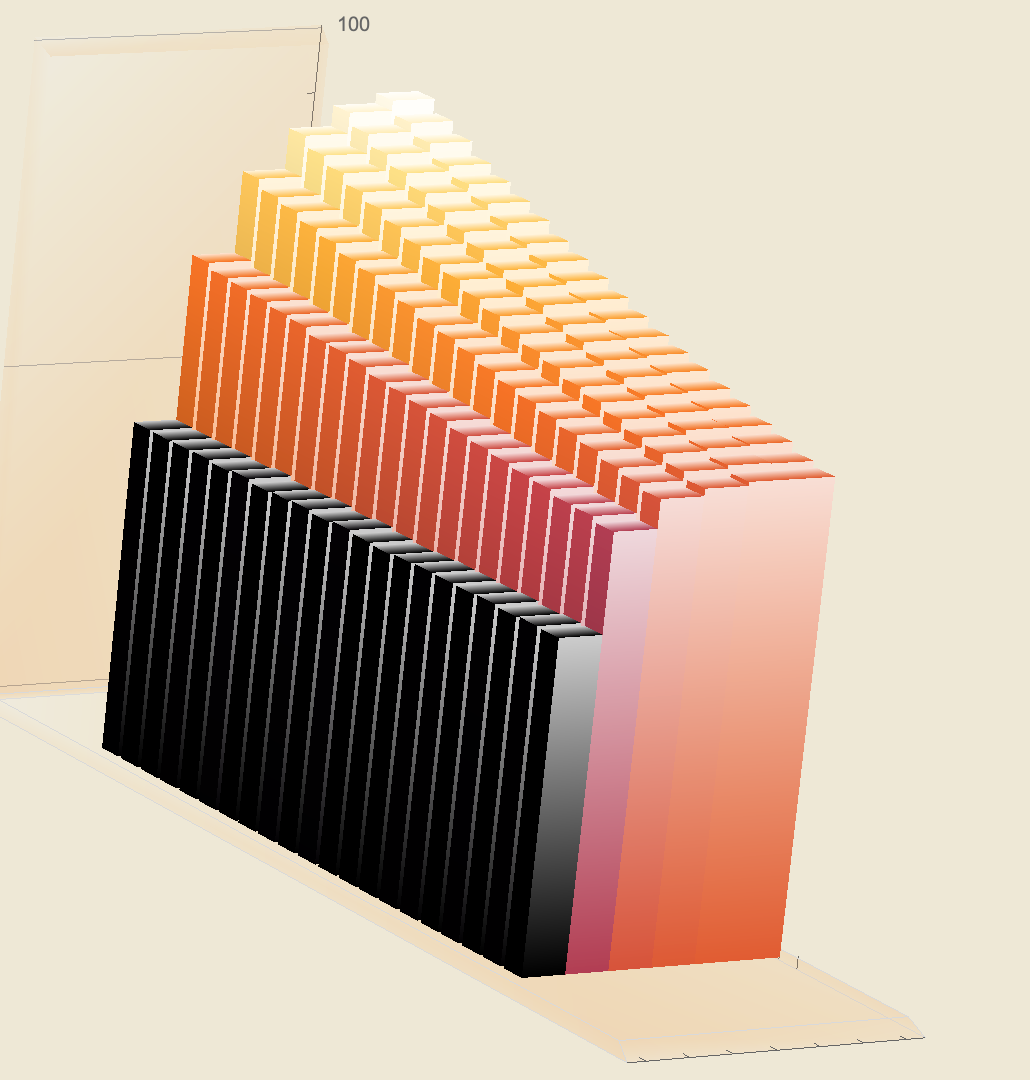
I'm trying to find an option for BarChart3D (or some other 3D plotting function) which will allow me to visualize a set of data which should be continuous (i.e. interpolated) along one dimension, but discrete along the other. As a concrete example: enter image description here (generated with BarChart3D[data,ChartLayout -> "Grid",ColorFunction -> "SunsetColors"]

In the above plot, the dimension with only 6 increments is truly discrete, while the dimension with 21 increments is actually continuous, and has just been sampled at discrete points. I'm trying to find a way to have basically the same visual as the bar chart, but with a smooth interpolated curve along the 21-point direction, still with the width/look of the bars. I've tried making some hacky attempts with ListPlot3D, but can never get the colors to work very well. Any advice or help would be appreciated!

$\endgroup$
1
  • 1
    $\begingroup$ Please share what you have, as it will make it easier to see what you're looking for. If the problem is the colors, perhaps someone can figure out how to fix those. $\endgroup$
    – C. E.
    Commented May 19, 2020 at 8:22

2 Answers 2

6
$\begingroup$

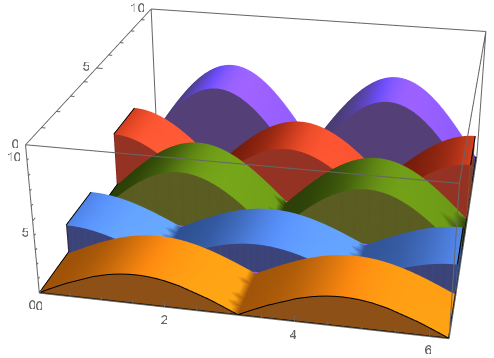
Plot3D example:

Plot3D[{
  2 Abs@Sin[x] Boole[0 < y < 2],
  2 Abs@Cos[x] Boole[2 < y < 4],
  4 Abs@Sin[x] Boole[4 < y < 6],
  4 Abs@Cos[x] Boole[6 < y < 8],
  6 Abs@Sin[x] Boole[8 < y < 10]
  },
 {x, 0, 2 Pi},
 {y, 0, 10},
 Filling -> Bottom,
 FillingStyle -> Opacity[1],
 Mesh -> False,
 PlotRange -> {{0, 2 Pi}, {0, 10}, {0, 10}}
 ]

Plot3D example

I'm assuming here that you already have the interpolation functions, and that what remains is plotting them.

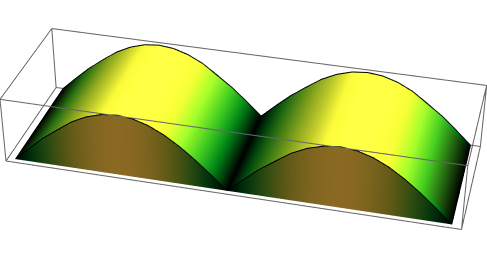
If you need more control over the look than Plot3D gives you, the best way I can think of is to make the filling yourself with graphics primitives. Here's a proof of concept:

data = Table[{x, 0, Abs@Sin[x]}, {x, 0, 2 Pi, 0.01}];
left = Partition[data, 2, 1];
right = Partition[{0, 2, 0} + # & /@ data, 2, 1];

fillingPolygon[{{x1_, y1_, z1_}, {x2_, y2_, z2_}}] :=
 {
  EdgeForm[],
  ColorData["AvocadoColors", Mean[{z1, z2}]],
  Polygon[{
    {x1, y1, z1},
    {x2, y2, z2},
    {x2, y2, 0},
    {x1, y1, 0}
    }]
  }

Show[
 Graphics3D[{
   fillingPolygon /@ left,
   fillingPolygon /@ right
   }],
 Plot3D[
  Abs@Sin[x],
  {x, 0, 2 Pi},
  {y, 0, 2},
  Mesh -> False,
  ColorFunction -> "AvocadoColors",
  ColorFunctionScaling -> False
  ]
 ]

Custom filling example

$\endgroup$
2
  • $\begingroup$ This is a really helpful answer! However, I'm having trouble with it, because I need to have the ColorFunction still apply. This is simple to do for the tops of the curves, but I want the FillingStyle to be the same color as the height of the plot, as is the case for the BarChart example. Is there a way to do this? $\endgroup$ Commented May 19, 2020 at 14:23
  • $\begingroup$ @KHAAAAAAAAN I added a note about a possible way forward. $\endgroup$
    – C. E.
    Commented May 19, 2020 at 15:50
4
$\begingroup$

Update: Combining all steps in a function:

ClearAll[minMax, hybridBarChart]
minMax = Table[f[[1]][{f[[2]][Through@#@x], #2[[1]] < x <= #2[[2]]}, 
       x] &[##], {f, {{NMaxValue, Max}, {NMinValue, Min}}}] &;

hybridBarChart[funcs_, range_, labels_: Automatic, cf_: "Rainbow"][
  opts : OptionsPattern[]] := Module[{minmax = minMax[funcs, range]},
  Show[Table[ParametricPlot3D[{t, i, v funcs[[i]][t]}, {t, range[[1]], 
      range[[2]]}, {v, 0, 1}, 
     ColorFunction -> (ColorData[{cf, minmax}][ funcs[[i]][#4]] &), 
     ColorFunctionScaling -> False, opts, Method -> "Extrusion" -> .5,
      PlotPoints -> 50, Mesh -> None], {i, Length@funcs}], 
   Ticks -> {Automatic, Transpose[{Range[Length@funcs], 
       labels /. Automatic -> Range[Length@funcs]}], Automatic}, 
   FilterRules[{opts}, Options @ Graphics3D], ImageSize -> Large, 
   Lighting -> "Neutral", PlotRange -> All, BoxRatios -> {1, 1, 1/2}]]

Examples :

functions = Function /@ (Range[5] Abs[Sin[#]]);

labels = "data" <> ToString[#] & /@ Range[Length @ functions];

hybridBarChart[functions, {0, 3 Pi}][ImageSize -> Medium, BaseStyle -> Opacity[.5]]
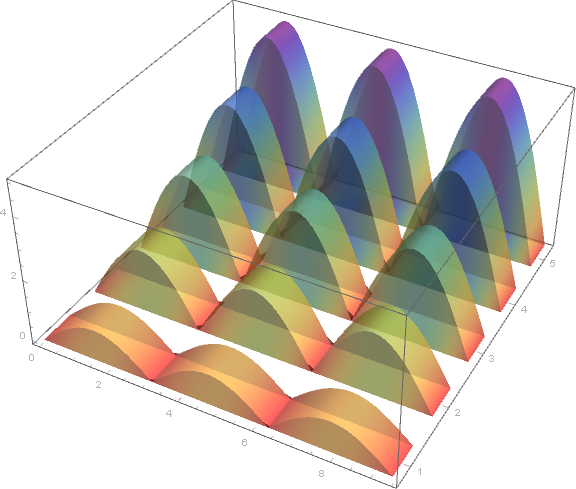
enter image description here

hybridBarChart[functions, {0, 3 Pi}, labels, "SolarColors"][
 Method -> "Extrusion" -> .8, ImageSize -> Medium]
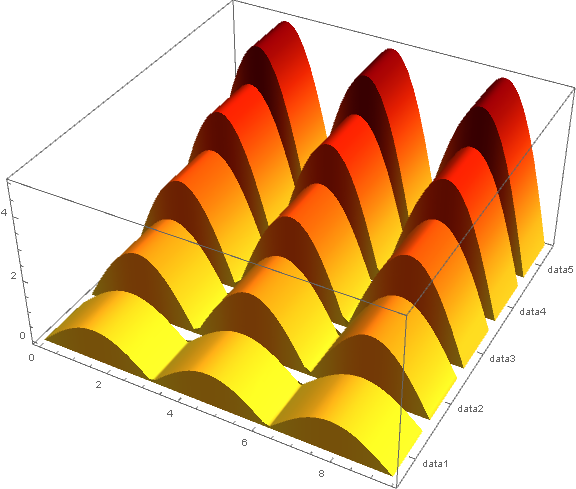
enter image description here

Original answer:

You can also use ParametricPlot3D with the option "Extrusion":

functions = Function /@ (Range[5] Abs[Sin[#]]);

labels = "data" <> ToString[#] & /@ Range[Length @ functions];

max = NMaxValue[{Max[Through@functions@x], 0 < x <= 3 Pi}, x];
min = NMinValue[{Min[Through@functions@x], 0 < x <= 3 Pi}, x];

pp3D[f_, i_] := ParametricPlot3D[{t, i[[1]], v f[t]}, {t, 0, 3 Pi}, {v, 0, 1}, 
  PlotPoints -> 50, Mesh -> None, Method -> "Extrusion" -> .3, 
  ColorFunction -> (ColorData[{"Rainbow", {min, max}}][f[#4]] &), 
  ColorFunctionScaling -> False]

Show[MapIndexed[pp3D, functions],  ImageSize -> Large, 
 Lighting -> "Neutral", PlotRange -> All, BoxRatios -> {1, 1, 1/2}, 
 Ticks -> {Automatic, Transpose[{Range[Length@functions], labels}], Automatic}]
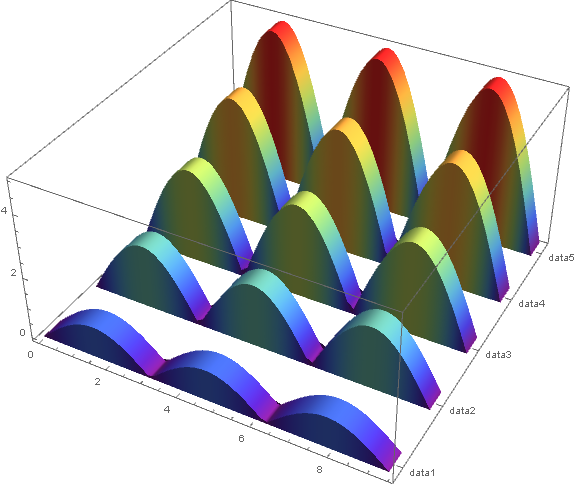
enter image description here

Add the option BaseStyle -> Opacity[.5] in the definition of pp3D to get
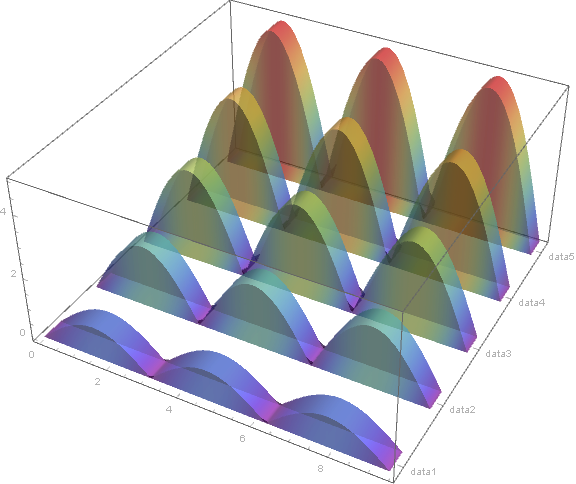
enter image description here

Use "Extrusion" -> 1 instead of "Extrusion" -> .3 to get
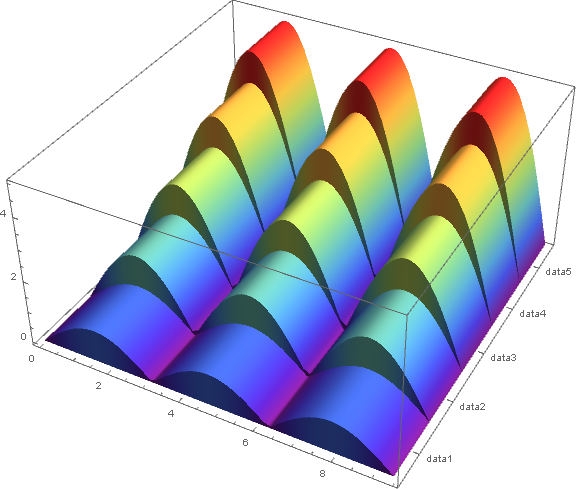
enter image description here

Change "Rainbow" to "AvocadoColors" to get
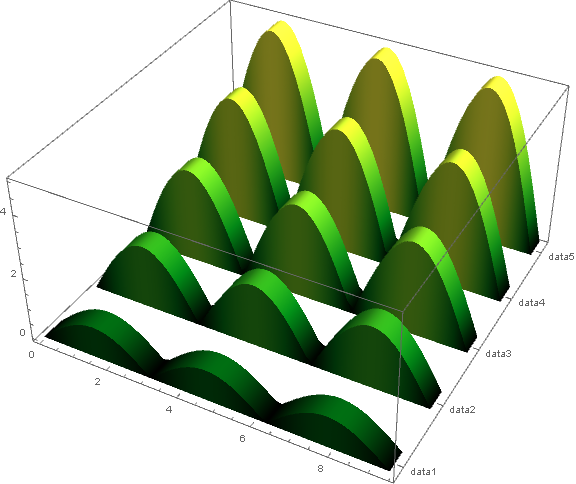
enter image description here

Use functions = Function /@ (Range[5] Abs[# Sin[#]]); to get
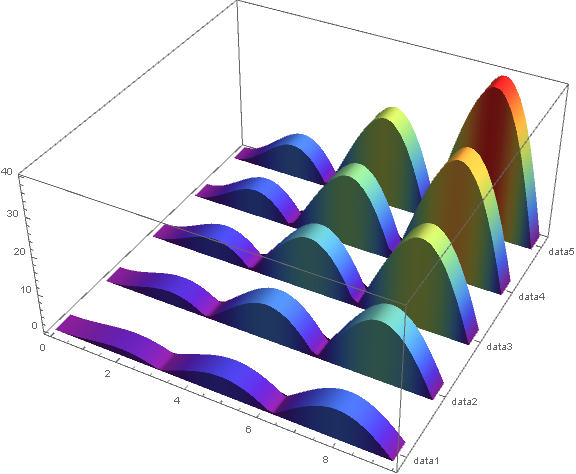
enter image description here

$\endgroup$

Your Answer

By clicking “Post Your Answer”, you agree to our terms of service and acknowledge you have read our privacy policy.

Not the answer you're looking for? Browse other questions tagged or ask your own question.