5
$\begingroup$

I have two related questions. First, I am trying to find out what ways I can change a single point in a plot using data wrappers that are not overwritten by other plot options (like PlotMarkers).

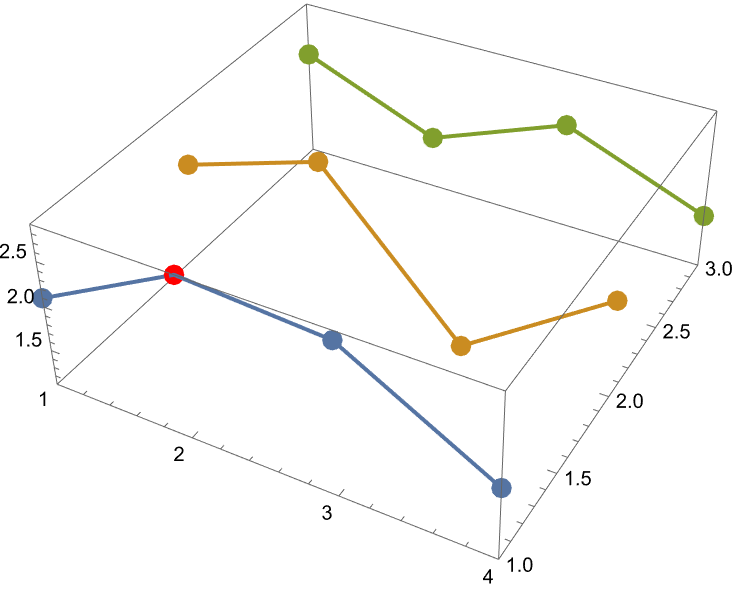
The following code succeeds in making red the point I want to be red.

ListLinePlot3D[{{2.1, Style[2.9, Red], 2.8, 1.9}, {2.2, 2.7, 1.1, 
   2.2}, {2.3, 1.7, 2.3, 1.7}}, PlotMarkers -> {Automatic, 0.03}]

1

Now, I want the same single point to be bigger, but this seems to be more difficult for reasons I do not understand, as you can see in my following two attempts...

  • using PointSize
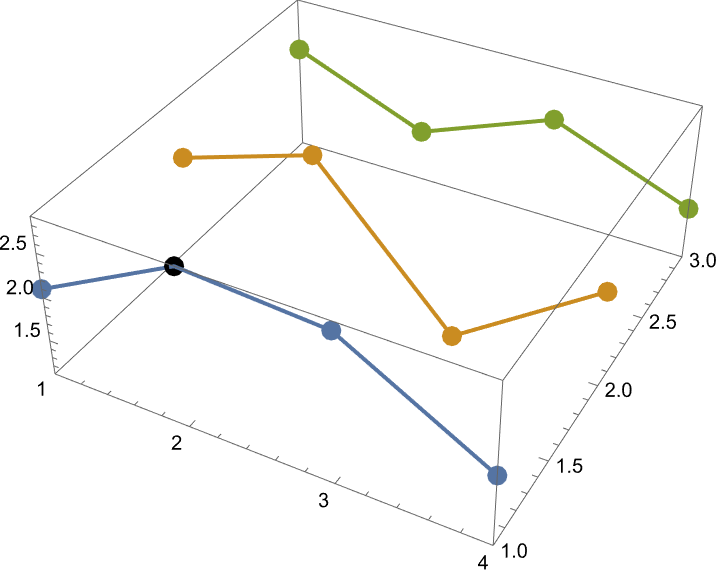
ListLinePlot3D[{{2.1, Style[2.9, Red, PointSize[0.1]], 2.8, 
   1.9}, {2.2, 2.7, 1.1, 2.2}, {2.3, 1.7, 2.3, 1.7}}, 
 PlotMarkers -> {Automatic, 0.03}]
  • using a number
ListLinePlot3D[{{2.1, Style[2.9, Red, 1], 2.8, 
   1.9}, {2.2, 2.7, 1.1, 2.2}, {2.3, 1.7, 2.3, 1.7}}, 
 PlotMarkers -> {Automatic, 0.03}]

Both give the same "default" output below. 2
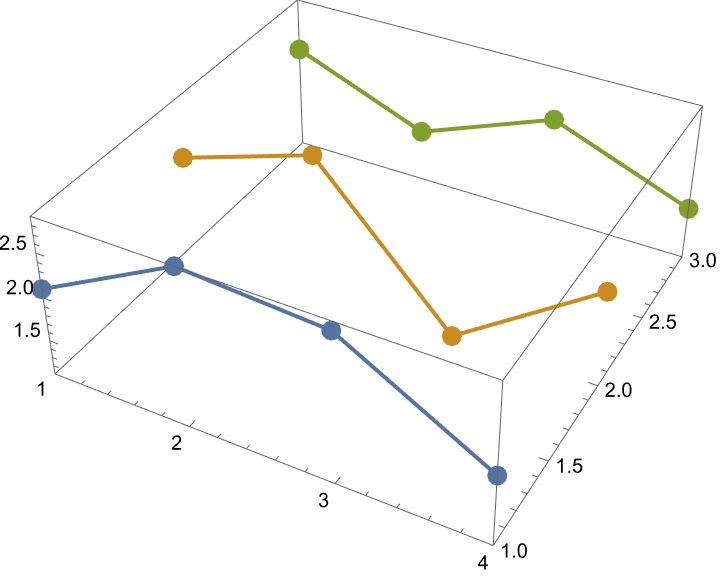
And this leads me to my second question. Notice the point is no longer red even though I still have it specified, as if my attempts at the specification of size prohibits the specification that the point be red, and no error is thrown.

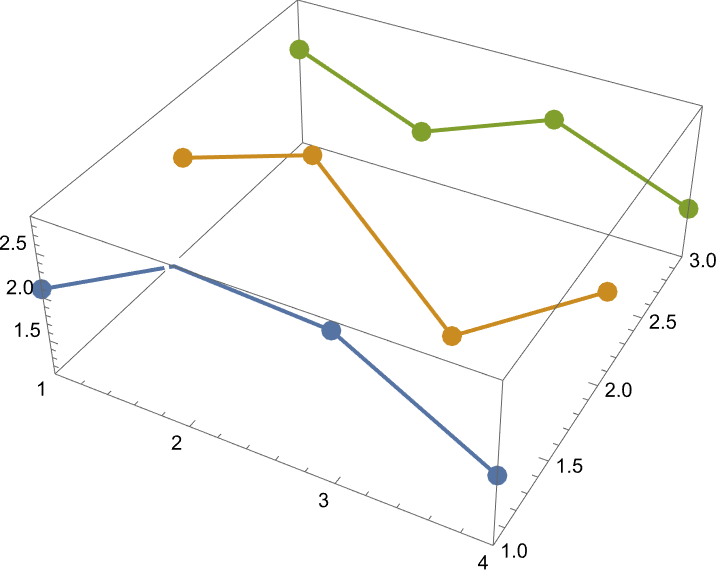
Something even more strange occurs when I remove the specification of color. With PointSize, the point turns black, not the default blue, and with a number, the point disappears entirely.

  • using PointSize
ListLinePlot3D[{{2.1, Style[2.9, PointSize[0.1]], 2.8, 1.9}, {2.2, 
   2.7, 1.1, 2.2}, {2.3, 1.7, 2.3, 1.7}}, 
 PlotMarkers -> {Automatic, 0.03}]

3

  • using a number
ListLinePlot3D[{{2.1, Style[2.9, 2], 2.8, 1.9}, {2.2, 2.7, 1.1, 
   2.2}, {2.3, 1.7, 2.3, 1.7}}, PlotMarkers -> {Automatic, 0.03}]

4

What's going on here?

Addendum

On a related note, I find this annoying.

The code

ListLinePlot3D[{{2.1, Style[2.9], 2.8, 1.9}, {2.2, 2.7, 1.1, 
   2.2}, {2.3, 1.7, 2.3, 1.7}}, PlotMarkers -> {Automatic, 0.03}]

and

ListLinePlot3D[{{2.1, Style[2.9, Automatic], 2.8, 1.9}, {2.2, 2.7, 
   1.1, 2.2}, {2.3, 1.7, 2.3, 1.7}}, PlotMarkers -> {Automatic, 0.03}]

do not give the same output. The second one colors the point black for some reason.

Related Questions

Preserving Automatic PlotMarker Styles in Plots

$\endgroup$

1 Answer 1

3
$\begingroup$

In this specific case the problem seems to be that the markers are generated using Point which has only VertexColors and VertexNormals as options. If one inspects the expression generated by the code examples it becomes clear that only under certain circumstances the color gets piped through correctly. Style[2.9, 2] leads to VertexColors->2 which causes the point to vanish and Style[2.9, PointSize[0.05]] leads to VertexColors->PointSize[0.05] where PointSize[0.05] somehow gets interpreted as black the same as Style[2.9, Automatic].

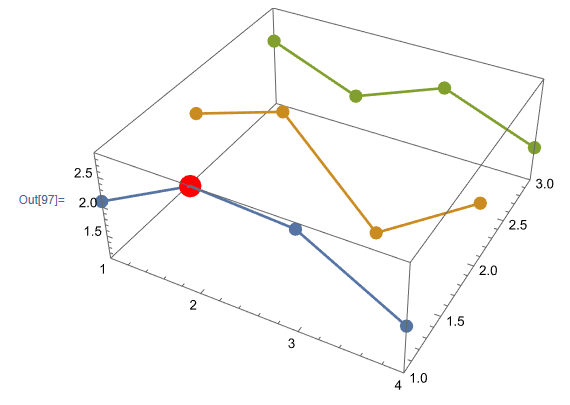
It does not seem possible to specify the point size inside Point but rather in typical Mathematica graphics fashion by prepending it: e.g. ...PointSize[0.05],Point[...],.... So one dirty hack to style individual points is marking them in code with e.g. Style[...,"s1"] and then use a rule to set the desired style once explicit code for the graphics is already generated:

ListLinePlot3D[{{2.1, Style[2.9, "s1"], 2.8, 1.9}, {2.2, 2.7, 1.1, 
    2.2}, {2.3, 1.7, 2.3, 1.7}}, PlotMarkers -> {Automatic, 0.03}];
% /. Point[y_, VertexColors -> "s1"] :> {PointSize[.05], 
   Point[y, VertexColors -> Red]}

resulting in

Plot

Granted this is a bit clumsy but at least it works. In fact manipulating plots or graphics in Mathematica using such rules is often the easiest solution for somewhat specialized applications like this one.

$\endgroup$
1
  • $\begingroup$ If markers are generated using Point, then it's not the same Point used in Graphics3D. Compare ListLinePlot3D[{{2.1, Style[2.9, Automatic], 2.8, 1.9}, {2.2, 2.7, Style[1.1, Automatic], 2.2}, {2.3, 1.7, Style[2.3, Automatic], 1.7}}, PlotMarkers -> {Point[{0, 0, 0}], 100}] with ListLinePlot3D[{{2.1, Style[2.9, Automatic], 2.8, 1.9}, {2.2, 2.7, Style[1.1, Automatic], 2.2}, {2.3, 1.7, Style[2.3, Automatic], 1.7}}, PlotMarkers -> Graphics3D[Point[{0, 0, 0}], Boxed -> False, ImageSize -> 100]]. (Referencing mathematica.stackexchange.com/q/266749/12697) $\endgroup$ Commented Apr 15, 2022 at 14:49

Your Answer

By clicking “Post Your Answer”, you agree to our terms of service and acknowledge you have read our privacy policy.

Not the answer you're looking for? Browse other questions tagged or ask your own question.