5
$\begingroup$

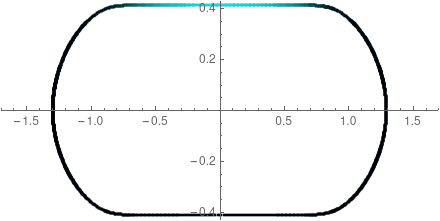
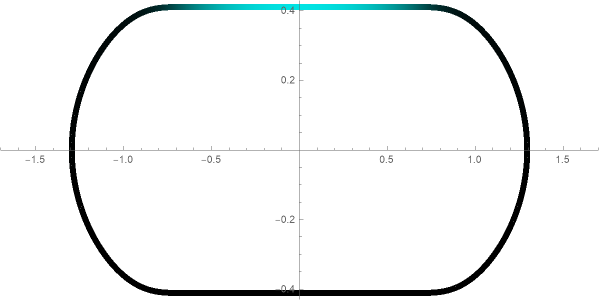
I have this Data and I would like to make a colored curve. Using LisPlot gives the desired colored curve, but using ListLinePlot adds noise to the curve. Here is the code(MATHEMATICA 12):

colorBar1[arg_] := Blend[{Black, Cyan}, Rescale[arg, {0, 1}]]
        ListPlot[Style[{#[[1]], #[[2]]}, colorBar1[#[[3]]]] & /@ Data, 
     PlotStyle -> Directive[Thickness[0.01]], Axes -> True, 
     AspectRatio -> 0.5, ImageSize -> 400, 
     PlotRange -> {{-1.7, 1.7}, {-0.43, 0.43}}]

enter image description here

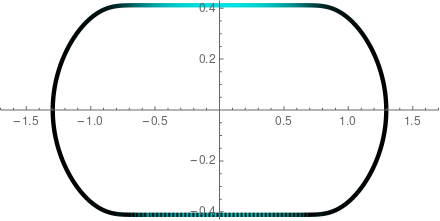
Now, using LisLinePlot gives this

size=Length[Data];
ListLinePlot[Data[[All, 1 ;; 2]], 
     ColorFunction -> 
      Function[{x, y}, 
       colorBar1[Data[[Position[Data[[All, 1]], x][[1, 1]], 3]]]], 
     ColorFunctionScaling -> False, 
     PlotStyle -> Directive[Thickness[0.01]], Axes -> True, 
     AspectRatio -> 0.5, ImageSize -> 400, 
     PlotRange -> {{-1.7, 1.7}, {-0.43, 0.43}}]

I don't know why the bottom branch of the curve is colored-dashed now?

enter image description here

$\endgroup$
5
  • $\begingroup$ What is the value of size in the code above? $\endgroup$
    – MarcoB
    Commented Apr 28, 2020 at 1:04
  • $\begingroup$ @MarcoB, code is updated. it is Length[Data] $\endgroup$
    – MMA13
    Commented Apr 28, 2020 at 1:07
  • 1
    $\begingroup$ Thank you for the update. You could write Data[[All, 1;;2]] then. $\endgroup$
    – MarcoB
    Commented Apr 28, 2020 at 1:10
  • $\begingroup$ @HD2006 have you tried using vertexcolors? $\endgroup$ Commented Apr 29, 2020 at 6:38
  • $\begingroup$ @CATrevillian, how can I do that? do you mean redefine the color function or color bar? $\endgroup$
    – MMA13
    Commented Apr 29, 2020 at 12:19

1 Answer 1

5
$\begingroup$

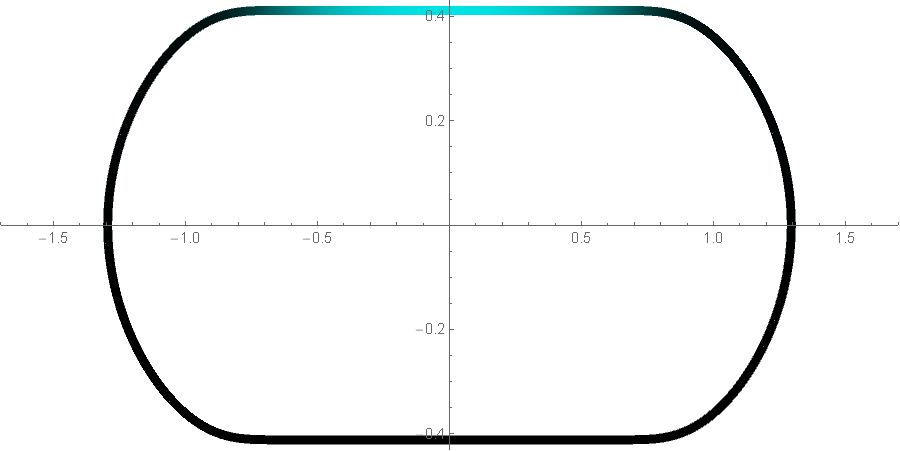
1. Use Nearest instead of Position in ColorFunction:

ListLinePlot[Data[[All, 1 ;; 2]], 
 ColorFunction -> Function[{x, y}, 
   colorBar1[Data[[First@Nearest[Data[[All, ;; 2]] -> "Index", {x, y}], 3]]]], 
 ColorFunctionScaling -> False, 
 PlotStyle -> Directive[Thickness[0.01]], Axes -> True, 
 AspectRatio -> 0.5, ImageSize -> 600, 
 PlotRange -> {{-1.7, 1.7}, {-0.43, 0.43}}]

enter image description here

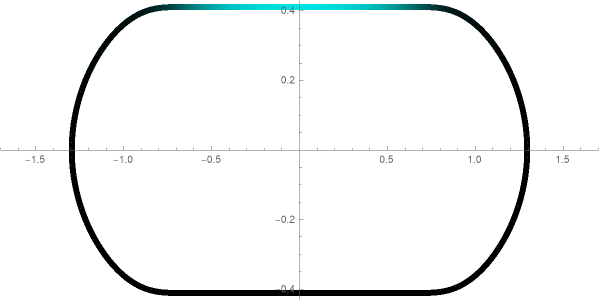
2. Post-process ListLinePlot output to add VertexColors:

ListLinePlot[Data[[All, ;; 2]], 
   PlotStyle -> Directive[Thickness[0.01]], Axes -> True, 
   AspectRatio -> 0.5, ImageSize -> 600, 
   PlotRange -> {{-1.7, 1.7}, {-0.43, 0.43}}] /. 
 Line[x_] :> Line[x, VertexColors -> (colorBar1 /@ Data[[All, 3]])]

enter image description here

3. Graphics + VertexColors

Graphics[{Thick,
  Line[Data[[All, ;; 2]], VertexColors -> (colorBar1 /@ Data[[All, 3]])]},
 AspectRatio -> 1/2, Axes -> True, ImageSize -> 600, 
 PlotRange -> {{-1.7, 1.7}, {-0.43, 0.43}}]

enter image description here

$\endgroup$
2
  • $\begingroup$ Oh the post processing bit is awesome! I still wonder what the problem was with OP’s second plot? $\endgroup$ Commented Apr 29, 2020 at 16:55
  • 2
    $\begingroup$ @CATrevillian, for some x values Position[Data[[All, 1]], x][[1, 1]] picks the rows (hence colors) associated with the top part of the curve. $\endgroup$
    – kglr
    Commented Apr 30, 2020 at 4:34

Your Answer

By clicking “Post Your Answer”, you agree to our terms of service and acknowledge you have read our privacy policy.

Not the answer you're looking for? Browse other questions tagged or ask your own question.