edited title
Link

ListPlot and ListLinePlot dondo not give the same results regarding the color?

deleted 6 characters in body
Source Link
MMA13
  • 4.8k
  • 3
  • 16
  • 25

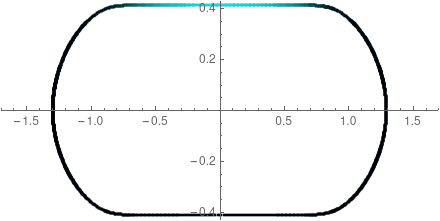
I have this Data and I would like to make a colored curve. Using LisPlot gives the desired colored curve, but using ListLinePlot adds noise to the curve. Here is the code(MATHEMATICA 12):

colorBar1[arg_] := Blend[{Black, Cyan}, Rescale[arg, {0, 1}]]
        ListPlot[Style[{#[[1]], #[[2]]}, colorBar1[#[[3]]]] & /@ Data, 
     PlotStyle -> Directive[Thickness[0.01]], Axes -> True, 
     AspectRatio -> 0.5, ImageSize -> 400, 
     PlotRange -> {{-1.7, 1.7}, {-0.43, 0.43}}]

enter image description here

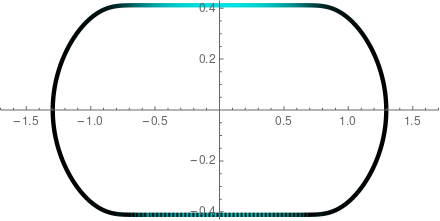
Now, using LisLinePlot gives this

size=Length[Data];
ListLinePlot[Data[[1 ;; sizeListLinePlot[Data[[All, 1 ;; 2]], 
     ColorFunction -> 
      Function[{x, y}, 
       colorBar1[Data[[Position[Data[[All, 1]], x][[1, 1]], 3]]]], 
     ColorFunctionScaling -> False, 
     PlotStyle -> Directive[Thickness[0.01]], Axes -> True, 
     AspectRatio -> 0.5, ImageSize -> 400, 
     PlotRange -> {{-1.7, 1.7}, {-0.43, 0.43}}]

I don't know why the bottom branch of the curve is colored-dashed now?

enter image description here

I have this Data and I would like to make a colored curve. Using LisPlot gives the desired colored curve, but using ListLinePlot adds noise to the curve. Here is the code(MATHEMATICA 12):

colorBar1[arg_] := Blend[{Black, Cyan}, Rescale[arg, {0, 1}]]
        ListPlot[Style[{#[[1]], #[[2]]}, colorBar1[#[[3]]]] & /@ Data, 
     PlotStyle -> Directive[Thickness[0.01]], Axes -> True, 
     AspectRatio -> 0.5, ImageSize -> 400, 
     PlotRange -> {{-1.7, 1.7}, {-0.43, 0.43}}]

enter image description here

Now, using LisLinePlot gives this

size=Length[Data];
ListLinePlot[Data[[1 ;; size, 1 ;; 2]], 
     ColorFunction -> 
      Function[{x, y}, 
       colorBar1[Data[[Position[Data[[All, 1]], x][[1, 1]], 3]]]], 
     ColorFunctionScaling -> False, 
     PlotStyle -> Directive[Thickness[0.01]], Axes -> True, 
     AspectRatio -> 0.5, ImageSize -> 400, 
     PlotRange -> {{-1.7, 1.7}, {-0.43, 0.43}}]

I don't know why the bottom branch of the curve is colored-dashed now?
enter image description here

I have this Data and I would like to make a colored curve. Using LisPlot gives the desired colored curve, but using ListLinePlot adds noise to the curve. Here is the code(MATHEMATICA 12):

colorBar1[arg_] := Blend[{Black, Cyan}, Rescale[arg, {0, 1}]]
        ListPlot[Style[{#[[1]], #[[2]]}, colorBar1[#[[3]]]] & /@ Data, 
     PlotStyle -> Directive[Thickness[0.01]], Axes -> True, 
     AspectRatio -> 0.5, ImageSize -> 400, 
     PlotRange -> {{-1.7, 1.7}, {-0.43, 0.43}}]

enter image description here

Now, using LisLinePlot gives this

size=Length[Data];
ListLinePlot[Data[[All, 1 ;; 2]], 
     ColorFunction -> 
      Function[{x, y}, 
       colorBar1[Data[[Position[Data[[All, 1]], x][[1, 1]], 3]]]], 
     ColorFunctionScaling -> False, 
     PlotStyle -> Directive[Thickness[0.01]], Axes -> True, 
     AspectRatio -> 0.5, ImageSize -> 400, 
     PlotRange -> {{-1.7, 1.7}, {-0.43, 0.43}}]

I don't know why the bottom branch of the curve is colored-dashed now?
enter image description here

added 74 characters in body
Source Link
MMA13
  • 4.8k
  • 3
  • 16
  • 25

I have this Data and I would like to make a colored curve. Using LisPlot gives the desired colored curve, but using ListLinePlot adds noise to the curve. Here is the code(MATHEMATICA 12):

colorBar1[arg_] := Blend[{Black, Cyan}, Rescale[arg, {0, 1}]]
        ListPlot[Style[{#[[1]], #[[2]]}, colorBar1[#[[3]]]] & /@ Data, 
     PlotStyle -> Directive[Thickness[0.01]], Axes -> True, 
     AspectRatio -> 0.5, ImageSize -> 400, 
     PlotRange -> {{-1.7, 1.7}, {-0.43, 0.43}}]

enter image description here

Now, using LisLinePlot gives this

size=Length[Data];
ListLinePlot[Data[[1 ;; size, 1 ;; 2]], 
     ColorFunction -> 
      Function[{x, y}, 
       colorBar1[Data[[Position[Data[[All, 1]], x][[1, 1]], 3]]]], 
     ColorFunctionScaling -> False, 
     PlotStyle -> Directive[Thickness[0.01]], Axes -> True, 
     AspectRatio -> 0.5, ImageSize -> 400, 
     PlotRange -> {{-1.7, 1.7}, {-0.43, 0.43}}]

I don't know why the bottom branch of the curve is colored-dashed now?

enter image description here

I have this Data and I would like to make a colored curve. Using LisPlot gives the desired colored curve, but using ListLinePlot adds noise to the curve. Here is the code(MATHEMATICA 12):

colorBar1[arg_] := Blend[{Black, Cyan}, Rescale[arg, {0, 1}]]
ListPlot[Style[{#[[1]], #[[2]]}, colorBar1[#[[3]]]] & /@ Data, 
 PlotStyle -> Directive[Thickness[0.01]], Axes -> True, 
 AspectRatio -> 0.5, ImageSize -> 400, 
 PlotRange -> {{-1.7, 1.7}, {-0.43, 0.43}}]

enter image description here

Now, using LisLinePlot gives this

ListLinePlot[Data[[1 ;; size, 1 ;; 2]], 
 ColorFunction -> 
  Function[{x, y}, 
   colorBar1[Data[[Position[Data[[All, 1]], x][[1, 1]], 3]]]], 
 ColorFunctionScaling -> False, 
 PlotStyle -> Directive[Thickness[0.01]], Axes -> True, 
 AspectRatio -> 0.5, ImageSize -> 400, 
 PlotRange -> {{-1.7, 1.7}, {-0.43, 0.43}}]

I don't know why the bottom branch of the curve is colored-dashed now?

enter image description here

I have this Data and I would like to make a colored curve. Using LisPlot gives the desired colored curve, but using ListLinePlot adds noise to the curve. Here is the code(MATHEMATICA 12):

colorBar1[arg_] := Blend[{Black, Cyan}, Rescale[arg, {0, 1}]]
        ListPlot[Style[{#[[1]], #[[2]]}, colorBar1[#[[3]]]] & /@ Data, 
     PlotStyle -> Directive[Thickness[0.01]], Axes -> True, 
     AspectRatio -> 0.5, ImageSize -> 400, 
     PlotRange -> {{-1.7, 1.7}, {-0.43, 0.43}}]

enter image description here

Now, using LisLinePlot gives this

size=Length[Data];
ListLinePlot[Data[[1 ;; size, 1 ;; 2]], 
     ColorFunction -> 
      Function[{x, y}, 
       colorBar1[Data[[Position[Data[[All, 1]], x][[1, 1]], 3]]]], 
     ColorFunctionScaling -> False, 
     PlotStyle -> Directive[Thickness[0.01]], Axes -> True, 
     AspectRatio -> 0.5, ImageSize -> 400, 
     PlotRange -> {{-1.7, 1.7}, {-0.43, 0.43}}]

I don't know why the bottom branch of the curve is colored-dashed now?

enter image description here

Source Link
MMA13
  • 4.8k
  • 3
  • 16
  • 25
Loading