I cannot give the actual image (contains private information) but the results of
TextRecognize[
 ImageResize[img, Scaled[2]], "Word", "BoundingBox",
 RecognitionPrior -> "Column"]
are the following set of rectangles; this being a small portion of the rectangles. (Note: I do not use "Line" as third argument as there is no white space in the returned text so no indication of the column the text falls under.)
recs =
  {Rectangle[{18, 1140}, {74, 1162}],
   Rectangle[{622, 1140}, {713, 1162}],
   Rectangle[{821, 1140}, {875, 1162}],
   Rectangle[{134, 1088}, {208, 1110}],
   Rectangle[{214, 1096}, {230, 1098}],
   Rectangle[{238, 1088}, {284, 1110}],
   Rectangle[{292, 1082}, {386, 1110}],
   Rectangle[{623, 1088}, {703, 1110}],
   Rectangle[{822, 1088}, {871, 1110}],
   Rectangle[{1137, 1088}, {1201, 1110}],
   Rectangle[{18, 1036}, {74, 1058}],
   Rectangle[{134, 1036}, {204, 1058}],
   Rectangle[{213, 1044}, {228, 1046}],
   Rectangle[{237, 1036}, {283, 1058}],
   Rectangle[{291, 1030}, {385, 1058}],
   Rectangle[{623, 1036}, {703, 1058}],
   Rectangle[{1137, 1036}, {1198, 1058}],
   Rectangle[{17, 984}, {74, 1006}],
   Rectangle[{133, 984}, {301, 1006}],
   Rectangle[{311, 990}, {318, 992}],
   Rectangle[{327, 984}, {421, 1006}],
   Rectangle[{623, 984}, {658, 1006}],
   Rectangle[{821, 984}, {875, 1006}],
   Rectangle[{1138, 984}, {1201, 1006}]};
The layout of the "Words" in the image can be see with
Framed[
 Labeled[Graphics[{LightGray, EdgeForm[Blue], recs}], "Words", Top],
 FrameStyle -> Gray]
From this example it can be seen that there are 5 columns; actual grids can contain more or less columns. This example also has one "sentence" column; a column made up of several closely spaced (in the x-axis) words; actual grids can contain more or less "sentence" columns.
I would like to cluster each cell of the grid into sublists. The "sentence" columns will have all of their rectangles in one sublist. The target is clustering is
recsByCell = {{Rectangle[{18, 1140}, {74, 1162}]},
   {Rectangle[{622, 1140}, {713, 1162}]},
   {Rectangle[{821, 1140}, {875, 1162}]},
   {Rectangle[{134, 1088}, {208, 1110}],
    Rectangle[{214, 1096}, {230, 1098}],
    Rectangle[{238, 1088}, {284, 1110}],
    Rectangle[{292, 1082}, {386, 1110}]},
   {Rectangle[{623, 1088}, {703, 1110}]},
   {Rectangle[{822, 1088}, {871, 1110}]},
   {Rectangle[{1137, 1088}, {1201, 1110}]},
   {Rectangle[{18, 1036}, {74, 1058}]},
   {Rectangle[{134, 1036}, {204, 1058}],
    Rectangle[{213, 1044}, {228, 1046}],
    Rectangle[{237, 1036}, {283, 1058}],
    Rectangle[{291, 1030}, {385, 1058}]},
   {Rectangle[{623, 1036}, {703, 1058}]},
   {Rectangle[{1137, 1036}, {1198, 1058}]},
   {Rectangle[{17, 984}, {74, 1006}]},
   {Rectangle[{133, 984}, {301, 1006}],
    Rectangle[{311, 990}, {318, 992}],
    Rectangle[{327, 984}, {421, 1006}]},
   {Rectangle[{623, 984}, {658, 1006}]},
   {Rectangle[{821, 984}, {875, 1006}]},
   {Rectangle[{1138, 984}, {1201, 1006}]}};

Framed[
 Labeled[Graphics[
   MapIndexed[{ColorData[109]@*First@#2, #} &, recsByCell]],
  "Manual Clusters", Top],
 FrameStyle -> Gray]
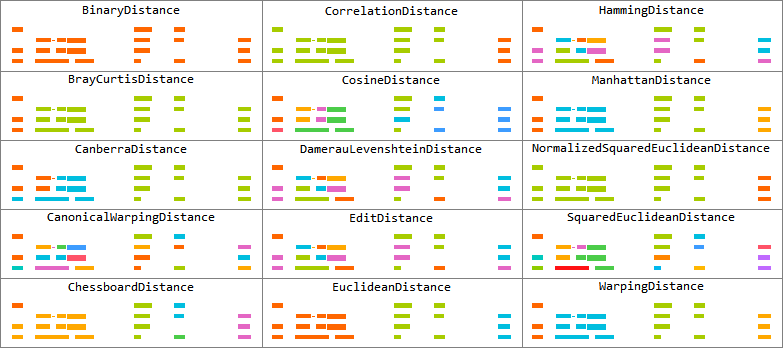
I have tried all DistanceFunctions while comparing the upper right-hand corner of the first rectangle to the upper left-hand corner of the right-hand rectangle.
Module[{df = #, c},
   c = FindClusters[recs,
     DistanceFunction -> (df[Last@#1, Flatten[List @@ #2][[{1, 4}]]] &)];
   Labeled[
    Graphics[MapIndexed[{ColorData[109]@*First@#2, #} &, c]],
    df, Top]
   ] & /@
 Symbol /@
  Select[StringEndsQ["Distance"]]@
   EntityValue[
    EntityList[
     EntityClass["WolframLanguageSymbol", {"FunctionalityAreas" -> "ClusteringSymbols"}]
    ],
   "Name"]//
 Multicolumn[#, 3,
   Frame -> All,
   FrameStyle -> Gray,
   Alignment -> Center] &
However, none are coming close to the desired result.
Any ideas on how the target clustering can be achieved in general? There will be both more and less columns and both more and less sentence type columns.
The goal is to recreate the grid of text in the image as Grid of strings with matching empty and filled cells.


MorphologicalComponents[Dilation[Image[1 - ImageData[Graphics[recs]]], 2]] // Colorizeas a first step? $\endgroup$