10
$\begingroup$

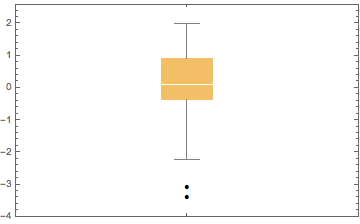
BoxWhiskerChart can detect and show outliers:

SeedRandom[39]
BoxWhiskerChart[
  RandomVariate[NormalDistribution[], 100],
  "Outliers"
]

enter image description here

  • What is the precise mathematical criterion used to decide if a point is an outlier?
  • Can this criterion be tweaked?
  • Is this criterion implemented by any documented built-in function?
$\endgroup$

3 Answers 3

12
$\begingroup$
iqrc = "IQRCoefficient" /. ChartElementData["BoxWhisker", "Options"];

1.5

fences = Quartiles[data][[{1, 3}]] + {-1, 1} iqrc InterquartileRange[data]

outliers = Select[Not @* Between[fences]] @ data

{-3.0844, -3.4005}

which matches the vertical coordinates of outlier glyphs:

Cases[BoxWhiskerChart[data, "Outliers", PerformanceGoal -> "Speed"], 
 Inset[_, {_, a_}] :> a, All]

{-3.0844, -3.4005}

$\endgroup$
3
  • $\begingroup$ Does ChartElementData[..., "Options"] appear anywhere within the documentation? I cannot find it (though I did find it in other SE answers). $\endgroup$
    – Szabolcs
    Commented Jan 15, 2020 at 8:25
  • 1
    $\begingroup$ @Szabolcs, afaik it does not appear in documentation. I think I bumped into it using the spelunking trick: ClearAttributes[ChartElementData, {Protected, ReadProtected}]; ?? ChartElementData $\endgroup$
    – kglr
    Commented Jan 15, 2020 at 10:34
  • 1
    $\begingroup$ I found one example in BarChart >> Options >> ChartElementFunction >> last example: ChartElementData["GradientRectangle", "Options"] $\endgroup$
    – kglr
    Commented Jan 15, 2020 at 10:39
10
$\begingroup$

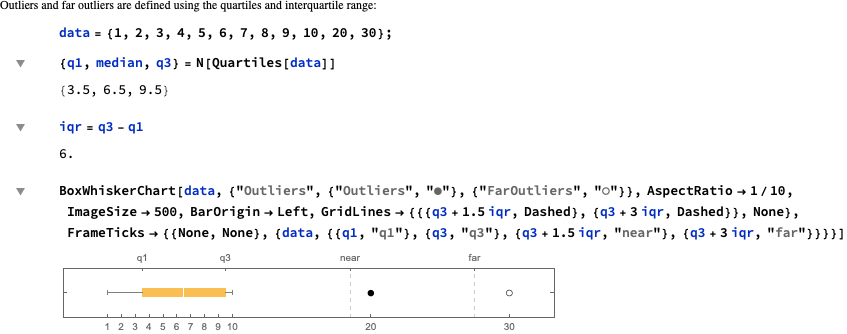
It is actually in the help documentation as the last item. Outliers are 1.5 InterQuartileRanges (IQR) away from the nearest quartile and Far Outliers are 3 IQR distant.

 Documentation Snippet from Properties & Relations

$\endgroup$
1
  • $\begingroup$ Indeed! It's under Properties and Relations. I found that, deleted the question, then undeleted when someone mentioned that they were just about to post an answer. $\endgroup$
    – Szabolcs
    Commented Jan 15, 2020 at 7:38
0
$\begingroup$

In order to tweak this option:

BoxWhiskerChart[data, "Outliers",
  ChartElementFunction -> 
    ChartElementDataFunction["BoxWhisker","IQRCoefficient" -> 3]
]
$\endgroup$

Your Answer

By clicking “Post Your Answer”, you agree to our terms of service and acknowledge you have read our privacy policy.

Not the answer you're looking for? Browse other questions tagged or ask your own question.