3
$\begingroup$

When you use the "MeanMarker" function within BoxWhiskerChart, does the mean shown on the box plot exclude the near and/or far outliers identified from the plot?

If not, is there a (relatively simple) way to have the mean marker shown on the plot exclude outliers?

$\endgroup$

2 Answers 2

4
$\begingroup$

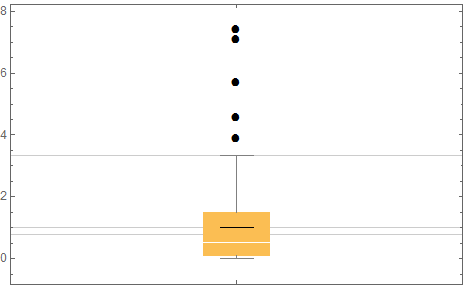
In answer to the first question, no, the mean does not exclude outliers:

SeedRandom[1]
r = RandomVariate[NormalDistribution[0, 1], 100]^2;

fence = Quantile[r, 0.95]
mean1 = Mean[r]
mean2 = Mean @ DeleteCases[r, x_ /; x > fence]
3.33858

1.01835

0.770329
BoxWhiskerChart[r, {{"Outliers"}, {"MeanMarker"}}, 
 GridLines -> {{}, {fence, mean1, mean2}}]

enter image description here

Regarding the second question one could calculate these as I did for mean2 above and plot them with Epilog but there may be a simpler way. I'll see what I can find.

$\endgroup$
2
  • 1
    $\begingroup$ Have you looked at TrimmedMean[], by any chance? $\endgroup$ Commented Jul 12, 2016 at 6:20
  • $\begingroup$ @J.M. Thanks for the hint! Despite that being around since version 6 I don't think I have ever used it. $\endgroup$
    – Mr.Wizard
    Commented Jul 12, 2016 at 6:27
3
$\begingroup$
ClearAll[trimmedMeansF]
trimmedMeansF[dir_: Directive[Thick, Opacity[1, Red]]] := BoxWhiskerChart[
   ConstantArray[#, 2] & /@ TrimmedMean[Transpose@#, {0, .05}],
  {{"Fences", None}, {"Whiskers", Opacity[0]}, {"MedianMarker", 
      Opacity[0]}, {"MeanMarker", .8, dir}}] &;

Example:

SeedRandom[1]
r = RandomVariate[NormalDistribution[0, 1], 100]^2;
rr = {r, 1 + r, 2 + r};

Legended[Show[BoxWhiskerChart[rr,{{"Outliers"}, {"MeanMarker", Directive[Thick, Yellow]}}, 
                  ChartStyle -> 1, GridLines -> {None, Mean@Transpose@rr}], 
              trimmedMeansF[Directive[Thick, Cyan]]@rr], 
 LineLegend[Directive[Thick, #] & /@ {Yellow, Cyan}, {"means", "trimmed means"}]]
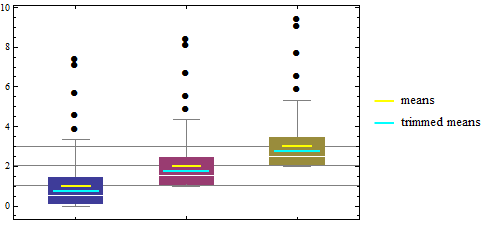
Mathematica graphics

Alternatively, post-process to modify the position of the mean markers:

means1 = Mean@Transpose@rr;
means2 = TrimmedMean[Transpose@rr, {0, .05}];
bwc = BoxWhiskerChart[rr, {{"Outliers"}, {"MeanMarker", Directive[Thick, Yellow]}}, 
   GridLines -> {None, means1}, PlotLabel -> TableForm[{means1, means2}, 
     TableHeadings -> {{"means", "trimmedmeans"}, {"data1", "data2", "data3"}}], 
   ChartStyle -> 1, ImageSize -> 400];

Row[{bwc, bwc /. With[{sel = Select[Cases[bwc, _LineBox, Infinity], 
       Not[FreeQ[#, Alternatives @@ means1]] &]}, 
    Thread[sel -> ( sel /. Thread[means1 -> means2])]]}]
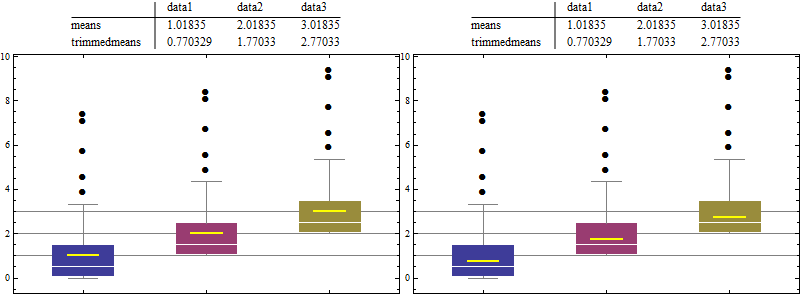
Mathematica graphics

$\endgroup$

Your Answer

By clicking “Post Your Answer”, you agree to our terms of service and acknowledge you have read our privacy policy.

Not the answer you're looking for? Browse other questions tagged or ask your own question.