2
$\begingroup$

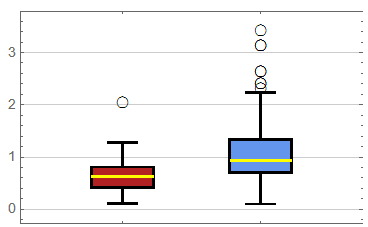
Is it possible to automatically remove the outliers that are detected by "Outliers" within BoxWhiskerChart? Somehow DeleteAnomalies does not seem always seem to work. Any ideas? Essentially I want to remove the outliers showing with the circle in the figure

enter image description here

where the data is

data1 = {0.4203, 0.1087, 0.1366, 0.2416, 0.6286, 0.7908, 0.7615, 1.2565, \
0.7069, 0.1799, 0.8107, 0.2604, 1.0147, 0.8855, 0.4444, 0.4328, 0.44, \
2.0391, 0.7383, 0.2205, 0.692, 0.3859, 0.192, 0.6309, 0.6164, 0.4937, \
0.803, 0.4569, 0.5222, 0.938, 0.7956, 0.8166, 0.7562, 1.2832, 0.8581}

data2 = {0.2383, 0.3546, 0.8735, 0.6548, 0.5984, 0.4561, 0.8556, 0.7986, \
0.2181, 1.058, 0.9113, 0.4884, 0.1871, 0.3989, 0.238, 1.0243, 0.7271, \
0.3641, 0.3796, 0.3016, 0.2945, 0.4193, 0.724, 0.2771, 0.5613, \
0.7667, 0.9729, 0.3815, 0.4142, 0.7455, 0.8616, 0.5757, 0.5664, \
0.1015, 0.4917, 0.6048, 0.8877, 0.8456, 1.3226, 0.8138, 0.7868, \
1.5958, 0.7256, 0.7353, 0.5801, 0.8084, 0.7004, 0.6247, 0.6765, \
0.8071, 0.9352, 0.4119, 1.2578, 1.756, 0.8905, 0.1325, 0.9153, \
0.4019, 0.368, 0.6376, 0.784, 0.3875, 0.957, 0.6789, 0.948, 0.7024, \
0.7062, 0.2084, 0.4043, 0.745, 0.7742, 0.7769, 0.4801, 0.7978, \
0.9004, 1.1708, 1.3341, 0.7376, 0.585, 0.9648, 0.9191, 0.3436, \
0.5804, 0.735, 1.3176, 0.4748, 0.3699, 1.1614, 0.6834, 1.7399, \
0.6326, 1.8135, 0.4952, 0.4566, 0.7462, 0.7538, 1.3064, 1.248, \
1.3898, 0.3762, 1.0183, 2.4155, 0.7688, 1.4847, 1.3384, 1.0224, \
1.1651, 0.828, 1.5717, 1.5347, 1.867, 0.8935, 1.7056, 1.7457, 1.2412, \
1.0565, 1.2122, 0.8319, 0.9338, 0.8755, 2.0922, 0.7237, 1.1749, \
0.9267, 2.0414, 0.5219, 1.2608, 0.8713, 0.5236, 0.8465, 0.9993, \
0.9411, 0.8427, 0.8958, 0.9941, 0.7128, 0.9855, 0.618, 0.9618, \
1.5467, 1.264, 1.1727, 0.8993, 1.0647, 1.0588, 1.5056, 0.7994, \
0.8144, 0.4243, 1.9144, 0.8388, 1.366, 1.3539, 0.1452, 1.0353, \
1.0128, 1.8411, 0.8006, 1.6407, 1.0436, 1.1651, 1.1901, 2.636, \
0.9189, 1.3148, 0.7694, 0.8565, 0.8105, 0.7932, 1.0582, 1.0828, \
0.9881, 1.6959, 0.8257, 0.5502, 1.1671, 1.6598, 0.4298, 0.6475, \
3.4179, 1.3251, 1.7484, 1.4989, 0.6359, 0.793, 1.5982, 1.3591, 0.339, \
2.3133, 2.147, 1.19, 2.6426, 1.7799, 1.4941, 1.0867, 0.8212, 0.5932, \
0.7318, 1.6003, 1.3919, 0.6235, 1.3959, 1.2471, 0.8678, 1.0173, \
1.1953, 1.3272, 0.9823, 1.2895, 0.5696, 0.7819, 1.6519, 1.7479, \
0.708, 1.1658, 1.3489, 1.5388, 1.3527, 1.2879, 1.1967, 1.0487, \
2.4073, 0.886, 2.2007, 1.0977, 0.9994, 0.522, 0.9271, 3.1344, 1.194, \
1.6859, 1.52, 1.4362, 0.8689, 1.4533, 0.8735, 1.1683, 1.6501, 0.5921, \
2.1358, 1.5373, 1.327, 2.2383, 0.6617, 1.3859, 0.9786, 1.4722, \
1.4891, 0.9931, 0.7015, 1.6651, 1.3637, 1.06, 1.2336, 1.1873, 1.9456, \
1.8313, 3.1359, 1.2111, 1.5379, 1.1171, 1.511, 1.4938, 0.825, 1.0986}
$\endgroup$
8
  • 4
    $\begingroup$ Don’t do it. I’d call that data tampering. $\endgroup$
    – JimB
    Commented Jun 28, 2022 at 19:29
  • 1
    $\begingroup$ @JimB the OP is not asking if it's ethical, or scientifically sound, but how to accomplish a programming task that is not well explained in the documentation. This may not be a well-developed question, but it is on-topic. $\endgroup$
    – rhermans
    Commented Jun 29, 2022 at 11:40
  • 3
    $\begingroup$ @JimB It would be unethical only if the processed data is used to make a false claim. There is in no ethical problem if the procedure is disclosed, or if the use involves no claims. Furthermore, this is a Mathematica programming site, not a puritan holier than the pope ethics forum. $\endgroup$
    – rhermans
    Commented Jun 29, 2022 at 15:40
  • 1
    $\begingroup$ @JimB, while I argee, blindly removing data is not the right approach, it should not be taken to the extreme. Data cleaning is a thing, but should be done with care. Say you want to measure weights of cats, but you got several dogs, will you remove dogs? In my example I've specificaly mixed two distributions. $\endgroup$
    – I.M.
    Commented Jun 29, 2022 at 16:15
  • 4
    $\begingroup$ @I.M. Thanks. I've removed my downvote from your answer and changed it to an upvote. But in this world there needs to be more concern for ethical issues with making inferences from data (even if the ethical issues are only "potential"). $\endgroup$
    – JimB
    Commented Jun 29, 2022 at 16:50

3 Answers 3

5
$\begingroup$

From Wolfram MathWorld's explanation of Box-and-Whisker Plot outliers are defined as being the data points further than $3/2$ times the InterquartileRange from the Median.

removeoutlier[data_]:=Block[
    {mean, iqr},
    median = Median[data] ;
    iqr   = 3/2*InterquartileRange[data];
    Select[data, ( median -iqr < # < median +iqr )& ]
]

Other functions also remove "outliers", for instance, the HampelFilter, however, this uses a different definition of "outlier".

ResourceFunction["HampelFilter"][data2]
$\endgroup$
6
  • $\begingroup$ Why the downvotes? $\endgroup$
    – rhermans
    Commented Jun 29, 2022 at 14:51
  • $\begingroup$ Downvote addressed in a comment above. $\endgroup$
    – JimB
    Commented Jun 29, 2022 at 15:37
  • $\begingroup$ @rhermans, your definition of wiskers is wrong, Mean is not the right center tendency estimator for data with outliers $\endgroup$
    – I.M.
    Commented Jun 29, 2022 at 16:10
  • $\begingroup$ @I.M. I'm clearly stating that I'm using the definition on Wolfram MathWorld about Box-and-Whisker Plot. Is my implementation not what that definition states? $\endgroup$
    – rhermans
    Commented Jun 29, 2022 at 16:17
  • $\begingroup$ @rhermans, mean is not mentioned in the 1st link $\endgroup$
    – I.M.
    Commented Jun 29, 2022 at 16:29
3
$\begingroup$

(add a note as per JimB's request)

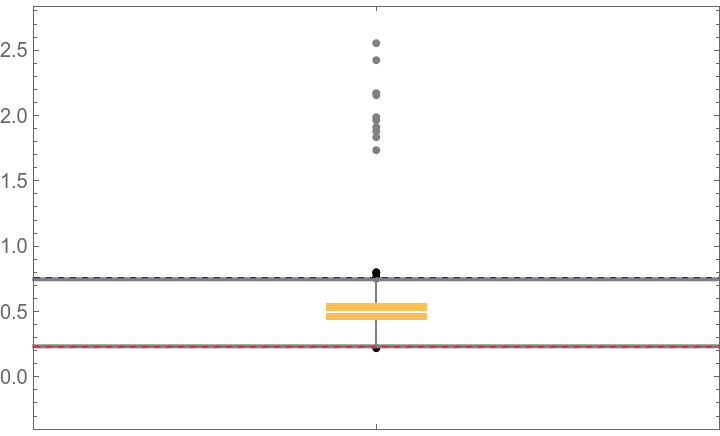
Note, data cleaning should be done with care. Simply removing data outside whiskers, do not guarantee the removed data to be 'true' outliers, i.e. drawn from a different distribution.

see wiki

(* generate test data *)
SeedRandom[1] ;
data = Join[
    RandomVariate[NormalDistribution[0.5, 0.1], 1000], (* -- true population *)
    RandomVariate[NormalDistribution[2.0, 0.25], 10]   (* -- outliers *)
] ;

(* compute wiskers using 1.5 iqr *)
{q$min, q$max} = Quantile[data, {1/4, 3/4}] ;
iqr = q$max - q$min ;
factor = 1.5 ;
{wisker$min, wisker$max} = {q$min - factor*iqr,  q$max + factor*iqr} ;

(* filter data *)
filtered = Select[data, IntervalMemberQ[Interval[{wisker$min, wisker$max}], #] &] ;

(* plot result *)
Show[
    BoxWhiskerChart[data, "Outliers", Method->{"BoxRange" -> "Quantile"}] ,
    Graphics[
        {
            Thick,
            Gray,
            InfiniteLine[{{0, Max[filtered]}, {1, Max[filtered]}}],
            InfiniteLine[{{0, Min[filtered]}, {1, Min[filtered]}}],
            Thin, Dashed,
            Red, InfiniteLine[{{0, wisker$min}, {1, wisker$min}}],
            Blue, InfiniteLine[{{0, wisker$max}, {1, wisker$max}}]
        }
    ]
]

enter image description here

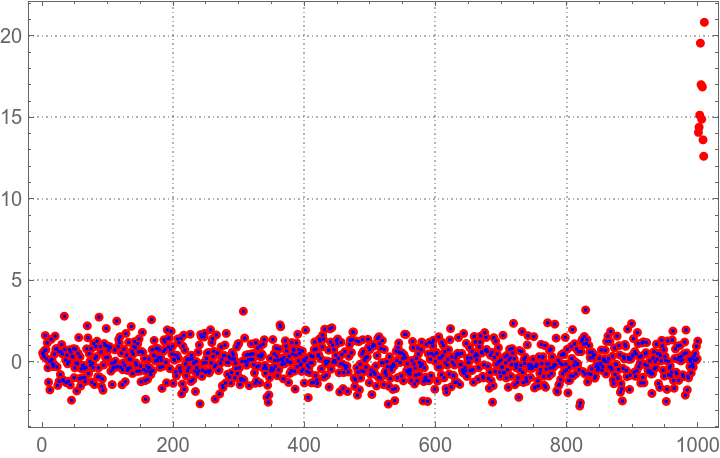
Another similar options based on robust dispersion:

center = Median[data] ;
spread = Sqrt[BiweightMidvariance[data]] ;
normal = (data - center)/spread ;
factor = 5.0 ;

filtered = Select[normal, IntervalMemberQ[Interval[{-factor, factor}], #] &] ;

ListPlot[
    {normal, filtered},
    PlotRange -> All, PlotStyle->{Directive[PointSize[Medium], Red], Blue},
    PlotTheme -> "Detailed"
]

enter image description here

$\endgroup$
1
$\begingroup$

My point in the comments (unfortunately not well stated) is not that removing outliers is bad (that can be a good thing) but it is the erasing of the outliers from a box plot of the original data is what is of concern as it can (and will much of the time) result in the wrong box plot for your outlier-removed data.

Consider using @rhermans function to remove potential (repeat: potential) outliers:

data1a = removeoutlier[data1];
data2a = removeoutlier[data2];

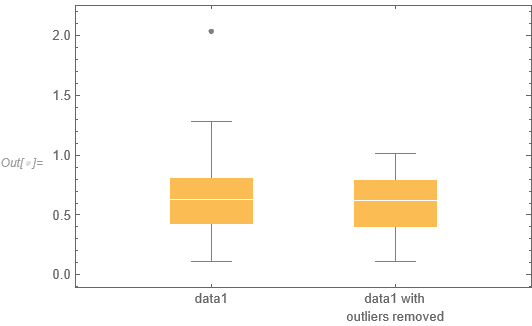
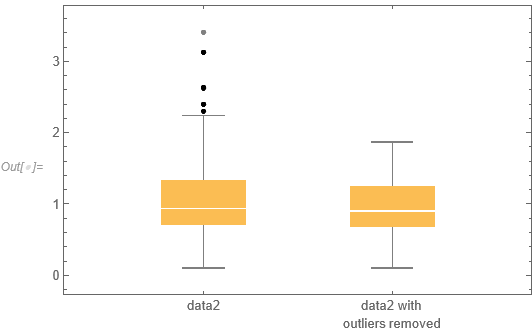
Now look at the box plots with and without the outliers:

BoxWhiskerChart[{data1, data1a}, "Outliers", 
 ChartLabels -> {"data1", "data1 with\noutliers removed"}]

BoxWhiskerChart[{data2, data2a}, "Outliers", 
 ChartLabels -> {"data2", "data2 with\noutliers removed"}]

Box plots for data1 with and without outliers

Box plots for data2 with and without outliers

One sees that just erasing the outliers from the original boxplot does not result in the same box plot as with the outliers removed. (And, of course, one needs to describe the potential outlier discovery method and the subsequent rationale for tossing any data.)

$\endgroup$
7
  • $\begingroup$ It's nice to hear from different perspectives and I appreciate your effort. Even though it might not be in the domain of the question, since you point out this subtle detail, I think showing alternatives such as BoxWhiskerChart[data2,"Outliers"]/.Inset[Style["\[FilledSmallCircle]",___], ___]->Nothing would also be helpful (exclude vs hide). $\endgroup$
    – Ben Izd
    Commented Jun 30, 2022 at 17:08
  • $\begingroup$ @BenIzd Thanks. I was certainly a bit harsh with my initial comments as I immediately went to "hide" rather than "exclude". But I've seen a lot of this in my career as a statistician. Most folks are completely innocent of wrong doing but even the appearance "hiding data" does set me off. And using subject-matter-free algorithms to exclude outliers is a close second. (To get a list of potential outliers, no problem. The problem is when the potential outliers are not checked against subject-matter knowledge.) $\endgroup$
    – JimB
    Commented Jun 30, 2022 at 17:56
  • $\begingroup$ @BenIzd I assume your example in your comment is showing "how to hide outliers" as opposed to "how to eliminate outliers" ? Also, if I asked a physics-related question here and it was full of holes, I would hope that someone would call me out on that. So "outside of Mathematica expertise" should be welcomed. $\endgroup$
    – JimB
    Commented Jun 30, 2022 at 18:00
  • $\begingroup$ Yes, the code is for hiding (which probably is not requested). I 100% agree with "outside of Mathematica expertise", we can find the code here and there but what is rare, is these experiences that are built over many years. $\endgroup$
    – Ben Izd
    Commented Jun 30, 2022 at 18:27
  • $\begingroup$ @BenIzd It's the "hiding" that causes me concern. My examples above shows that one gets the wrong boxplot when you do that. $\endgroup$
    – JimB
    Commented Jun 30, 2022 at 18:29

Your Answer

By clicking “Post Your Answer”, you agree to our terms of service and acknowledge you have read our privacy policy.

Not the answer you're looking for? Browse other questions tagged or ask your own question.