Well, I'm trying to investigate the density of solutions to Diophantine equations. What is a general method to describe that density?
I've two functions:
$$\varphi\left(\text{a},\text{b},\text{c}\right)=\theta\left(\text{a},\text{b},\text{c}\right)\tag1$$
I will look for solutions in the following range: $\text{a}=\left\{\text{a}_0,\dots,\text{a}_\text{n}\right\}$ and $y=\left\{\text{b}_0,\dots,\text{b}_\text{m}\right\}$. So I will choose $\text{a}_0$ as starting value and let $\text{b}$ run from $\text{b}_0$ until $\text{b}_\text{m}$ and check if there follows a $\text{c}\in\mathbb{Z}$. Now, if I let $\text{b}_0$ and $\text{b}_\text{m}$ constant what should I plot on the x-axis if I want to plot the solution density on the y-axis?
Example and my work:
I've the Diophantine equation:
$$x^2+\left(\frac{y}{3}\right)^2=z\tag2$$
In order to solve it $x$, $y$ and $z$ has to be integers.
I will look for solutions in the following range: $x=\left\{5,\dots,7\right\}$ and $y=\left\{-10,\dots,10\right\}$. Now I found $\text{p}=21$ soltuions.
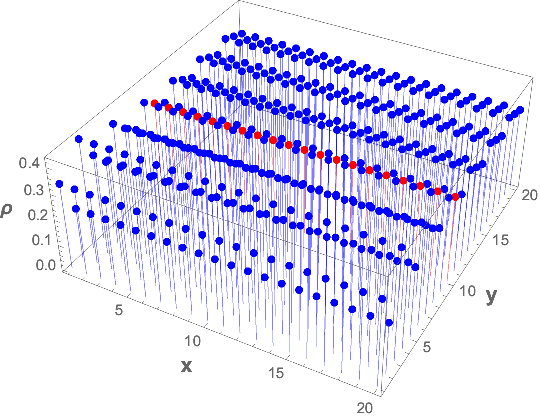
I used Mathematica to check them:
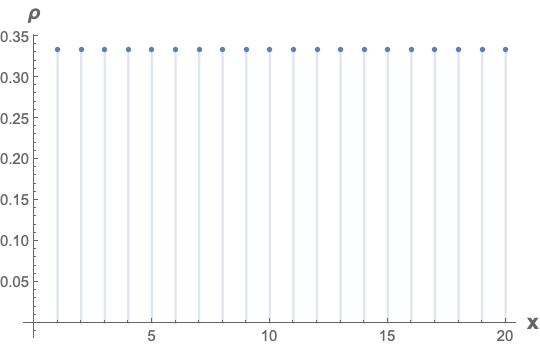
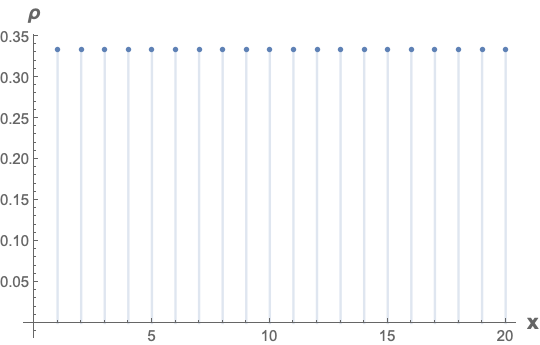
So, I should say that the density is given by:
$$\rho=\frac{\text{# solutions}}{\text{total possible solutions}}=\frac{21}{\left(1+7-5\right)\left(1+10-\left(-10\right)\right)}=\frac{21}{63}=\frac{1}{3}\tag3$$
Question: the general way of finding the solution density can be written as:
$$\rho=\frac{\text{# solutions}}{\left(1+x_\text{n}-x_0\right)\left(1+y_\text{m}-y_0\right)}\tag4$$
If I want to plot the function of $\rho$ on the y-axis what should be a smart choice to put on the x-axis? Assuming that I let $y_0$ and $y_\text{m}$ constant.


