5
$\begingroup$

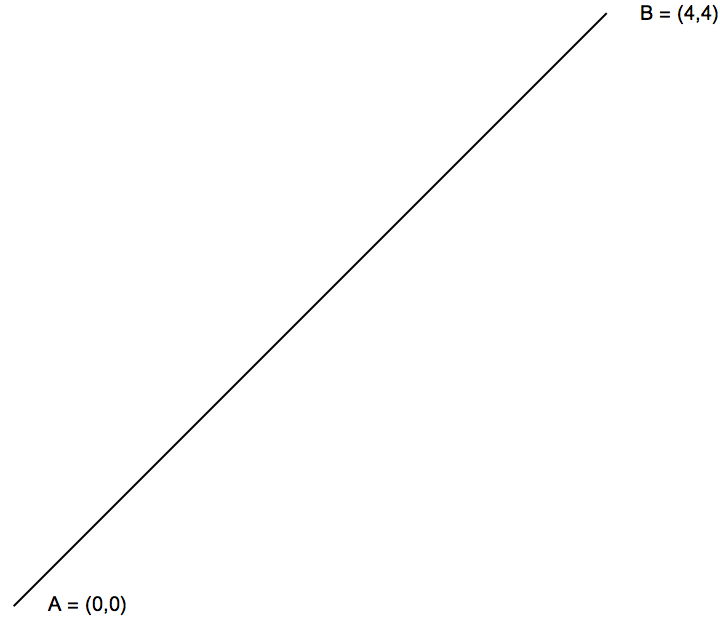
I have a line given by

line = Graphics[Line[{{0, 0}, {4, 4}}]]; 
 pointLabels = Graphics[
   {Text["A = (0,0)", {0.5, 0}], 
     Text["B = (4,4)", {4.5, 4}]}]; 
Show[line, pointLabels]

enter image description here

I want to divide it into i+1 equal lengths, where i is a number of my choosing, and where each length along the line is marked by a tick.

It would also be great if the evaluation outputted a list of the coordinates for each Tick.

How?

UPDATE:

I should have been clear about this - I understand how to do this mathematically. I want to know how to put ticks on a line in such a way that it creates i+1 equal divisions.

My comment about outputting the coordinates of the points was perhaps misleading.

Having said that, @halrutan's answer is the most comprehensive and I'll mark it as answered.

$\endgroup$

3 Answers 3

5
$\begingroup$

The math behind this is not hard. If you have two points p1 and p2, you can reach every point on the line between them by choosing 0<=f<=1 and calculating

$$p_1 + f\cdot(p_2-p_1)$$

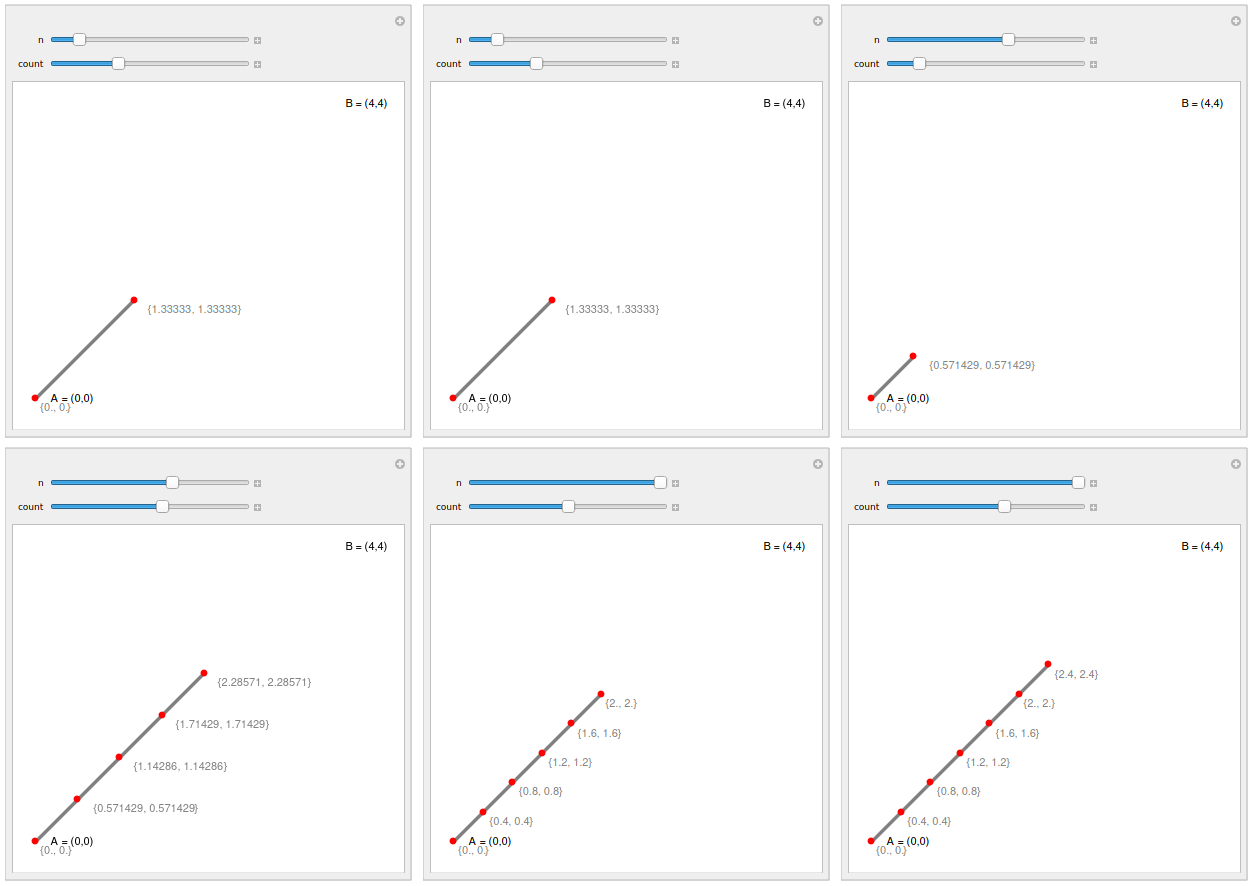
It's just linear interpolation. So when you divide the interval [0,1] into equally spaced points, you can easily create a table for all your points on the line.

enter image description here

The calculation of the points is done in the pts = ... part. The rest is only for display.

line = Graphics[Line[{{0, 0}, {4, 4}}]];
pointLabels = Graphics[{Text["A = (0,0)", {0.5, 0}], Text["B = (4,4)", {4.5, 4}]}];
gr = Show[line, pointLabels]

repl[n_ /; n > 1, num_] := Line[{p1_, p2_}] :> With[
   {
    pts = 
     Take[#, Min[num, Length[#]]] &@
      Table[p1 + i (p2 - p1), {i, 0, 1, 1.0/n}]
    },
   {Gray,
    Thickness[0.01],
    Line[Partition[pts, 2, 1]],
    Text[#, #, {-1.3, 1.3}] & /@ pts,
    Red,
    PointSize[0.02],
    Point[pts]
    }
   ]

Manipulate[
 gr /. repl[n, count],
 {n, 2, 10, 1},
 {count, 1, n + 1, 1}
 ]
$\endgroup$
2
  • $\begingroup$ Many thanks to both of you. I have updated my question in response to your answers. I wasn't clear that I understand the maths, I just need to know how to add the ticks. $\endgroup$ Commented Aug 28, 2019 at 19:59
  • $\begingroup$ "Lerping" + Subdivide[] (as in Okkes's answer) is nice, along with using dot products: With[{p1 = {0, 0}, p2 = {4, 4}, n = 7}, Transpose[{1 - #, #} &[Subdivide[n]]].{p1, p2} // Composition[Through, {Line, Point}] // Graphics] (@Richard, this is for you too) $\endgroup$ Commented Aug 30, 2019 at 7:45
4
$\begingroup$

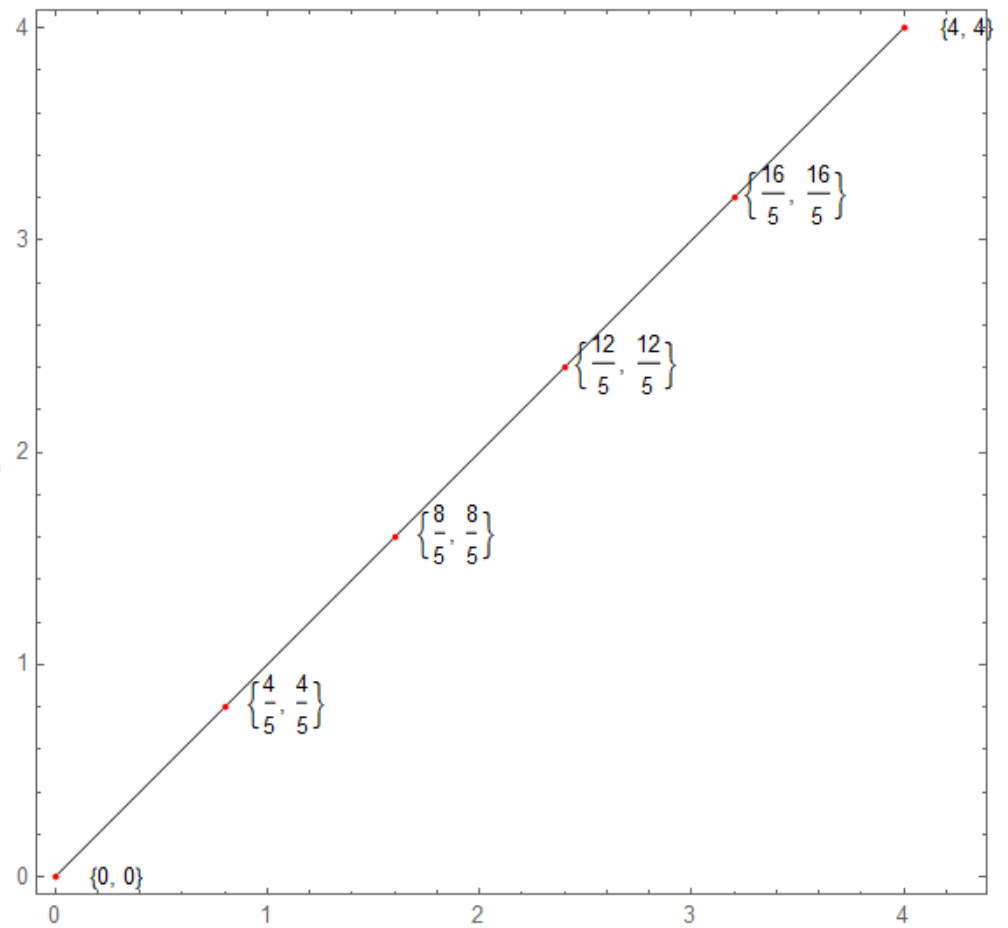
Here is a starting point.

x = y = Subdivide[4, 5];
pts = Transpose[{x, y}];  


Graphics[{Line[{{0, 0}, {4, 4}}], Text[#, # + {0.3, 0}] & /@ pts, Red,
  Point /@ pts}, Frame -> True]

enter image description here

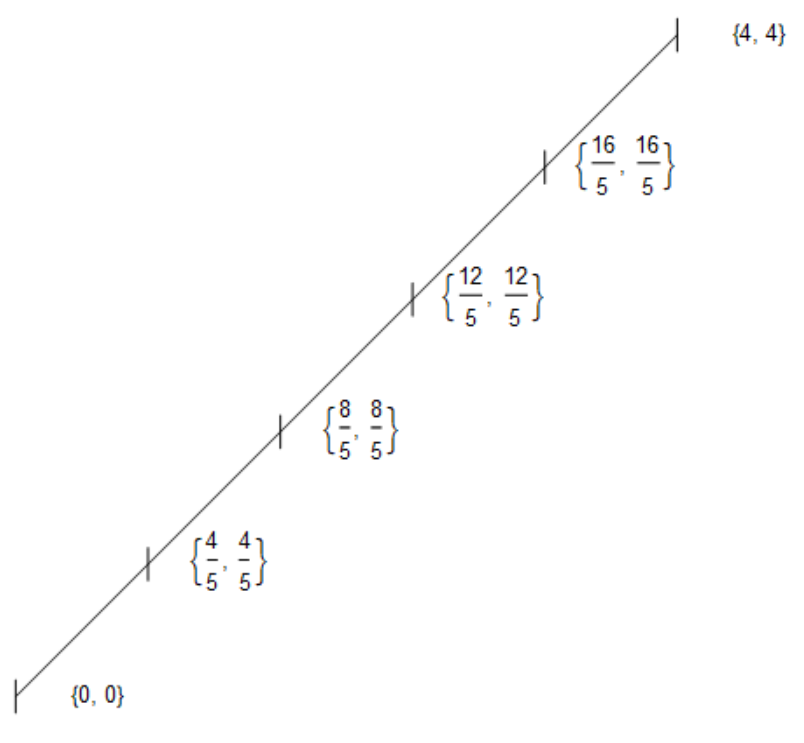
Edit:

dist = 0.1;
Graphics[{Line[{{0, 0}, {4, 4}}], Text[#, # + {0.5, 0}] & /@ pts, 
  Line[{{#[[1]], #[[2]] - dist}, {#[[1]], #[[2]] + dist}}] & /@ pts}]

enter image description here

$\endgroup$
1
  • $\begingroup$ I like your answer. Short and to the point. +1 $\endgroup$
    – halirutan
    Commented Aug 28, 2019 at 21:57
1
$\begingroup$
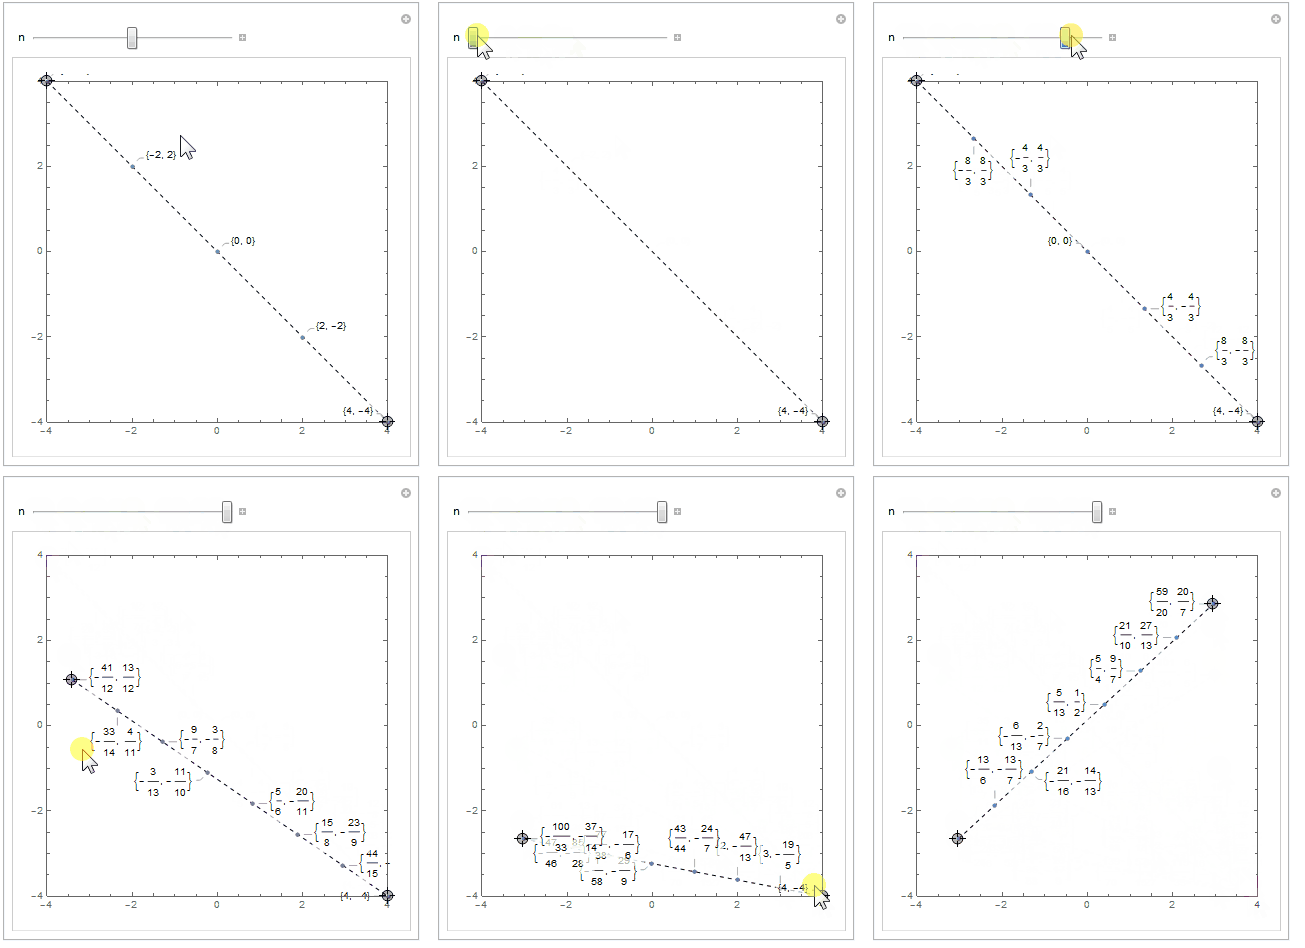
With[{pts = Subdivide[p1, p2, n]},
 Manipulate[
  Show[
   Graphics[{
     Black, AbsolutePointSize[4]
     , Black, Dashed, Line[{p1, p2}]
     , Red, Point@pts
     }
    , PlotRange -> {{-4, 4}, {-4, 4}}
    , Frame -> True
    ](* end Graphics *)
   ,
   ListPlot[
    Callout[#, Rationalize[#, 0.01]] & /@ pts
    ](* end ListPlot *)
   ],
  {{p1, {-4, 4}}, {-4, -4}, {4, 4}, Locator}
  , {{p2, {4, -4}}, {-4, -4}, {4, 4}, Locator}
  , {{n, 3}, 1, 7, 1}
  , TrackedSymbols :> All
  ] (* end Manipulate *)
 ](* end With *)

The rationalization of points is optional and is intended as a quick visual cue for establishing correctness for simple cases.

enter image description here

$\endgroup$

Your Answer

By clicking “Post Your Answer”, you agree to our terms of service and acknowledge you have read our privacy policy.

Not the answer you're looking for? Browse other questions tagged or ask your own question.