4
$\begingroup$

I am really looking just for the least amount of code needed to do this but it is still readable.

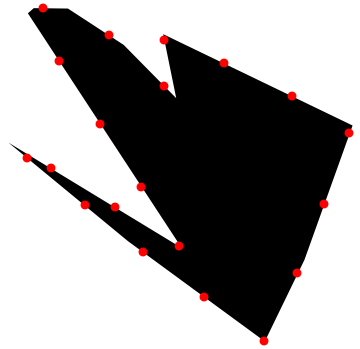
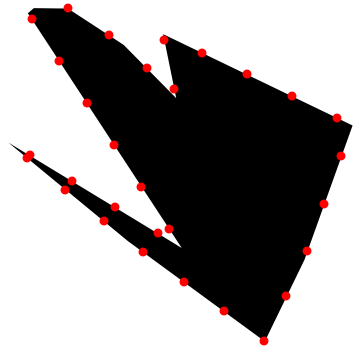
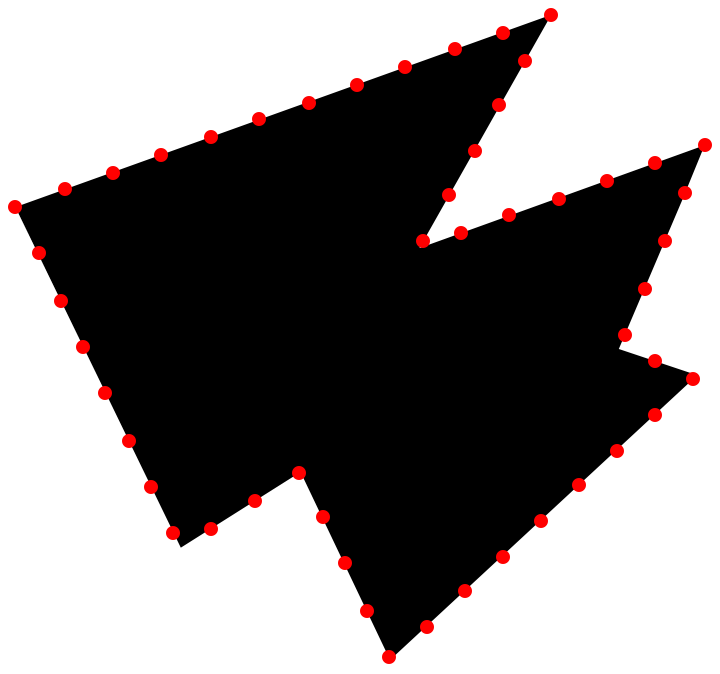
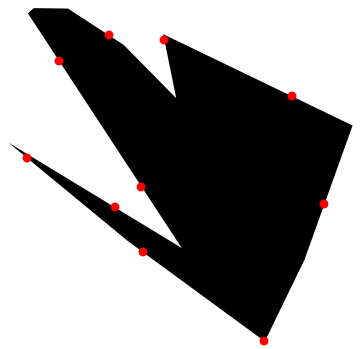
Here is the same polygon but the border is respectively split up into 10, 20, and 30 points along the perimeter:

Polygon with boundary split up into 10 equal parts. Polygon with boundary split up into 20 equal parts. Polygon with boundary split up into 30 equal parts.

The code I used to produce this is:

OrderVerticesClockwise[pts_List] := Module[
  {pivot, sorted, remainingPoints},
  
  (* Find the pivot: the lowest and leftmost point *)
  pivot = First[SortBy[pts, {Last, First}]];
  
  (* Remove the pivot from the list *)
  remainingPoints = DeleteCases[pts, pivot];
  
  (* Sort the remaining vertices based on the polar angle relative to the pivot *)
  sorted = SortBy[remainingPoints, ArcTan[#[[1]] - pivot[[1]], #[[2]] - pivot[[2]]] &];
  
  (* Return ordered vertices with the pivot at the beginning *)
  Prepend[sorted, pivot]
]

Clear[EquidistantPoints];

EquidistantPoints[pts_List, n_Integer] := Module[
  {
    closedPts = Append[pts, First[pts]],
    lengths, totalLength, interval, accumulatedLengths, currentPt, nextPt,
    distRemaining, currentIndex, result = {}
  },
  
  lengths = EuclideanDistance @@@ Partition[closedPts, 2, 1];
  totalLength = Total[lengths];
  interval = totalLength/n;
  
  accumulatedLengths = Accumulate[lengths];
  
  Do[
    distRemaining = i*interval;
    currentIndex = 1;
    
    While[distRemaining > accumulatedLengths[[currentIndex]],
      currentIndex++;
    ];
    
    distRemaining -= If[currentIndex > 1, accumulatedLengths[[currentIndex - 1]], 0];
    
    currentPt = closedPts[[currentIndex]];
    nextPt = closedPts[[currentIndex + 1]];
    
    AppendTo[result, currentPt + (distRemaining/lengths[[currentIndex]]) * (nextPt - currentPt)];
    
    , {i, 0, n - 1}
  ];
  
  result
]

equiArcLengthPointQuantity=20;
poly = RandomPolygon[12];
vertices = PolygonCoordinates[poly];
orderedVertices = OrderVerticesClockwise[vertices];
equiArcDistances = Accumulate[Table[Perimeter[poly]/equiArcLengthPointQuantity, {i, 1, equiArcLengthPointQuantity}]];
equidistantPts = EquidistantPoints[orderedVertices, equiArcLengthPointQuantity];

Graphics[
  {Polygon[orderedVertices], Red, PointSize[0.02], Point[equidistantPts]}
]

I would assume that there is a much simpler way of doing this, but I couldn't think of one. And I don't know what else to call these points. They aren't equally distanced points in Euclidean space, just along the perimeter by arc length.

$\endgroup$

4 Answers 4

8
$\begingroup$
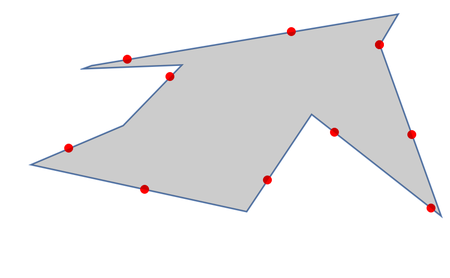
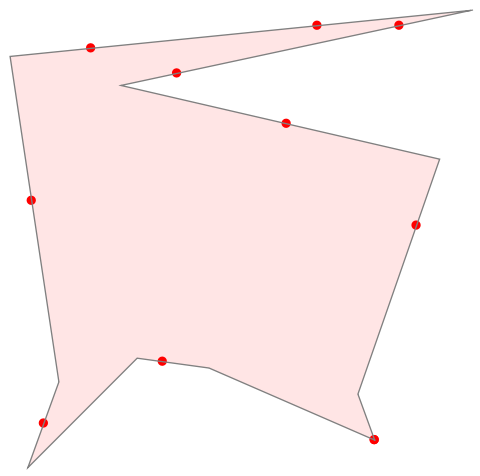
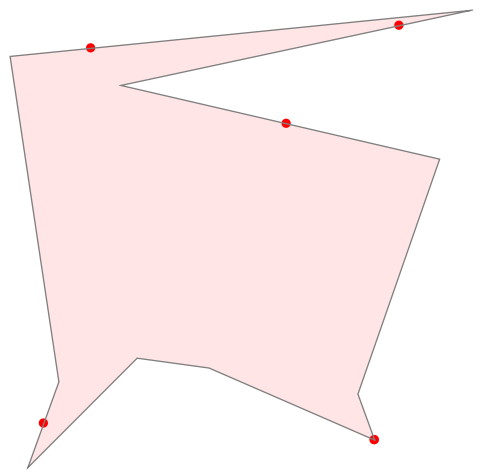
  • MeshFunctions -> {"ArcLength"} partly work.
poly = RandomPolygon[10];
plot=ListLinePlot[Append[#, First@#] &@poly[[1]], 
 MeshFunctions -> {0 &, "ArcLength"}, Mesh -> {Subdivide@10}, 
 MeshStyle -> Red, Epilog -> {Opacity[.2], poly}, Axes -> False]
pts =Cases[plot // Normal, Point[p_] :> p, -1] // DeleteDuplicates

enter image description here

$\endgroup$
10
  • 1
    $\begingroup$ Where did you find "ArcLength" for MeshFunctions? MeshFunctions -> {0 &, "ArcLength" $\endgroup$ Commented Aug 29, 2023 at 9:25
  • 3
    $\begingroup$ @DanielHuber The setting 0& come from mathematica.stackexchange.com/a/277682/72111 The MeshFunctions of "ArcLength" is well know in this forum. $\endgroup$
    – cvgmt
    Commented Aug 29, 2023 at 11:17
  • 1
    $\begingroup$ ArcLength seems not always to give equidistant points. E.g.: Plot[Sin[x ], {x, 0, 10}, MeshFunctions -> {0 &, ArcLength}, Mesh -> {10}, MeshStyle -> {PointSize[0.03]}] Do you know where to find info anout this? $\endgroup$ Commented Aug 29, 2023 at 11:44
  • 1
    $\begingroup$ @DanielHuber Mesh -> {10} will ignore the boundary points. So we need to use Mesh->{Subdivide@10} etc. $\endgroup$
    – cvgmt
    Commented Aug 29, 2023 at 11:46
  • 2
    $\begingroup$ @DanielHuber This points are equidistant. For example, Plot[Sin[x], {x, 0, π*3}, MeshFunctions -> {0 &, "ArcLength"}, Mesh -> {{0, 0.5, 1}}, MeshStyle -> {PointSize[0.03]}] or Plot[Sin[x], {x, 0, π*3}, MeshFunctions -> {0 &, "ArcLength"}, Mesh -> {Subdivide[0, 1, 6]}, MeshStyle -> {PointSize[0.03]}] $\endgroup$
    – cvgmt
    Commented Aug 29, 2023 at 12:01
4
$\begingroup$

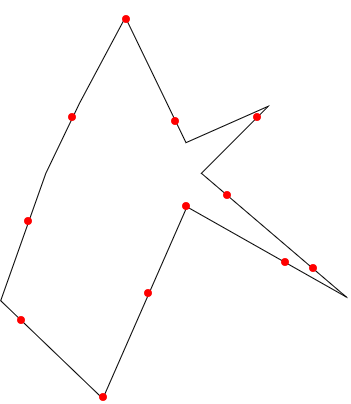
We first create the points of a random polygon:

m = 10 ; (* polygon *)
pts = CirclePoints[m];
pts = RandomReal[{0.1, 2}] # & /@ pts;
AppendTo[pts, pts[[1]]];

Then we calculate the lines and their lengths of the border:

border = Partition[pts, 2, 1];
dist = Total[Norm[Subtract @@ #] & /@ border]/n;

Finally we distribute the points along the perimeter:

n = 12;(* number of points *)
rest = 0;
pts1 = Reap[Sow[pts[[1]]];
    Scan[(tmp = #[[1]];
       While[rest + Norm[#[[2]] - tmp] >= dist,
        Sow[
         tmp = tmp + (dist - rest)/Norm[#[[2]] - tmp] (#[[2]] - tmp)];
         rest = 0;];
       rest = Norm[#[[2]] - tmp]) &, border]
    ][[2, 1]];
Graphics[{Line[pts], Red, PointSize[0.03], Point[pts1]}]

enter image description here

$\endgroup$
3
$\begingroup$

My primary tool is Interpolation:

 With[{poly = RandomPolygon[10], n = 50},
  With[{len = ArcLength@RegionBoundary@poly},
   (* Get a sequence of line segments. *)
   Partition[MeshPrimitives[poly, 2][[1, 1]] // Append[#, First@#] &, 
      2, 1, 1] //
     (* Create a linear constant-speed interpolation
        through polygon vertices. *)
     Interpolation[
       Transpose[
        {Accumulate[
          Prepend[EuclideanDistance @@@ Most@#, 0]], #[[All, 1]]}],
       InterpolationOrder -> 1] & //
    (* Generate points at constant intervals. *)
    Table[#[t], {t, 0, ((n - 1)/n) len, len/n}] &] // 
  Graphics[{poly, Red, PointSize@Large, Point@#}] &]

enter image description here

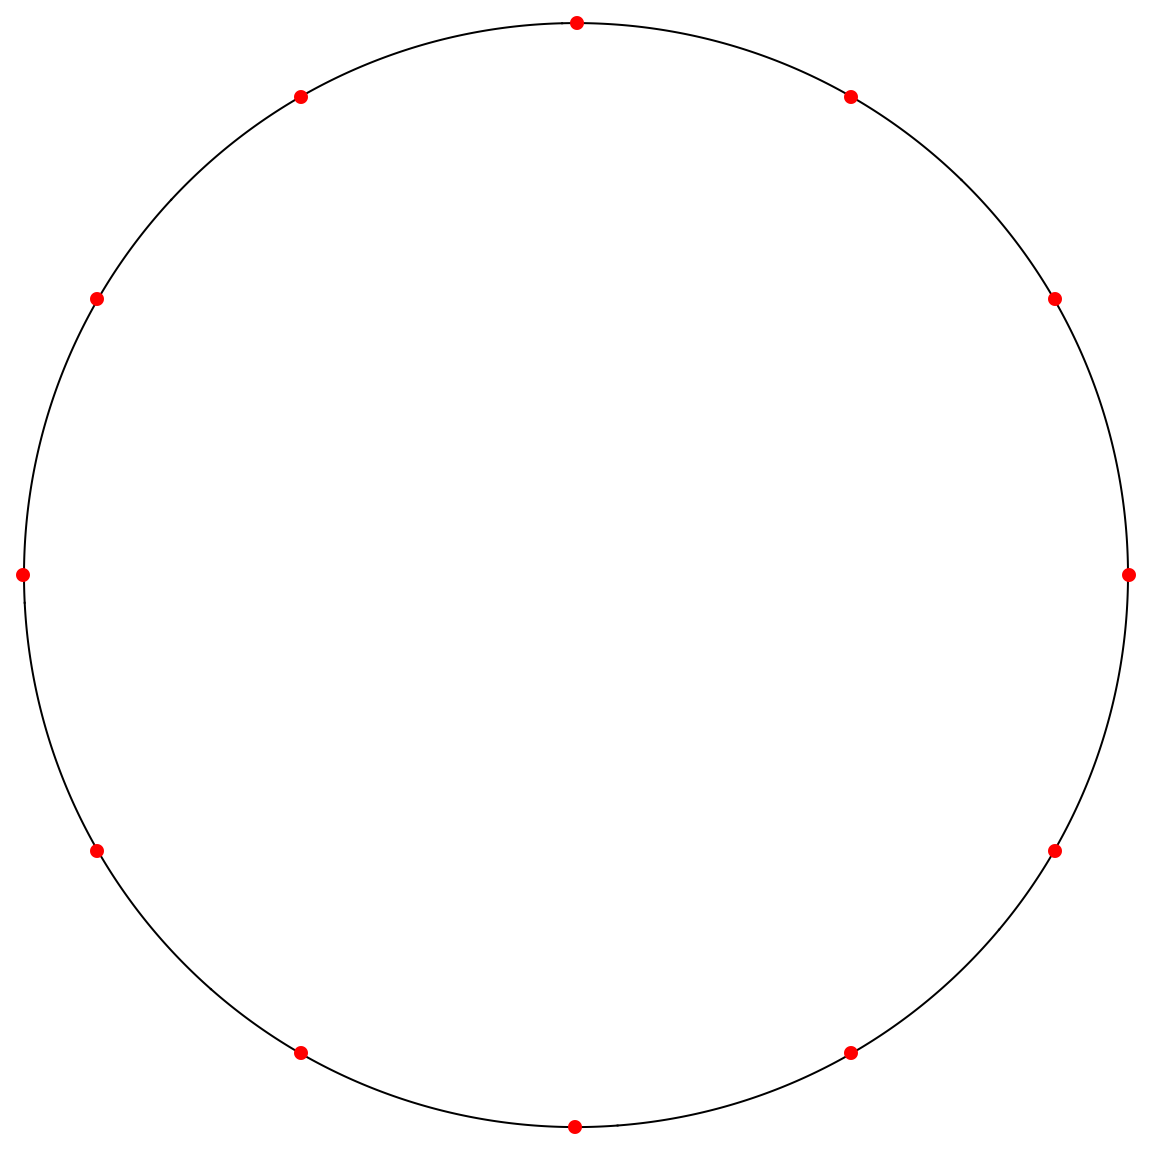
With poly = N@RegularPolygon[{1, 0}, 1000], n = 12:

enter image description here

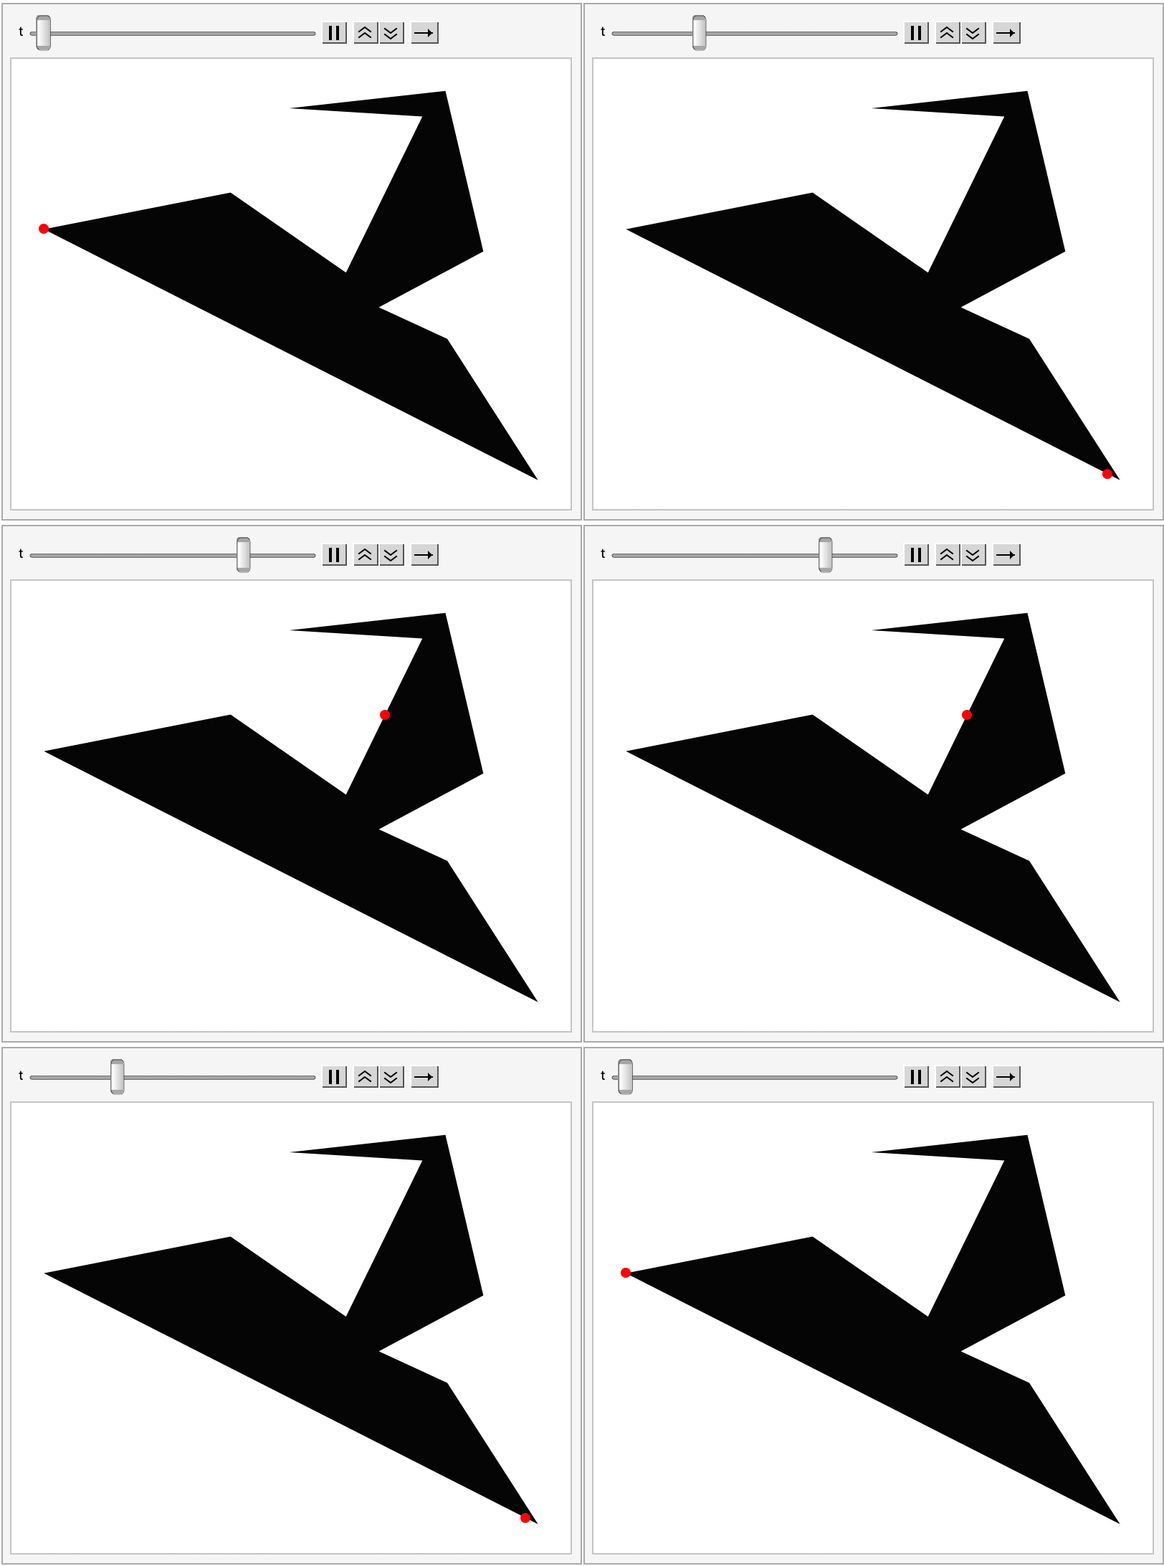
By replacing two last lines of code with this you get an animation:

Animate[Graphics[{poly, Red, PointSize@Large, Point@#[t]}], {t, 0, len}] &

enter image description here

$\endgroup$
3
$\begingroup$
Needs["GraphUtilities`"];

LSC[pts_, divs_] := Map[LineScaledCoordinate[pts, N @ #] &] @ Subdivide[divs]

Examples:

SeedRandom[1];

poly = RandomPolygon[10];

Graphics[{ Red , AbsolutePointSize[7], 
  Point[LSC[Append[#, First @ #] & @ poly[[1]], 10]], 
  EdgeForm[Gray], Opacity[.1], poly}]

enter image description here

Replace LSC[Append[#, First @ #] & @ poly[[1]], 10] with LSC[Append[#, First @ #] & @ poly[[1]], 5] to get

enter image description here

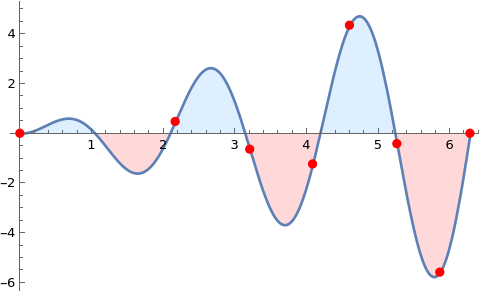
Plot[x Sin[3 x], {x, 0, 2 Pi}, 
 Filling -> Axis, 
 FillingStyle -> {LightRed, LightBlue},
 DisplayFunction -> 
  (Show[#, Epilog -> {Red, PointSize @ Large, 
     Point[First @ Cases[Normal@#, Line[x_] :> LSC[x, 7], All]]}] &)]

enter image description here

$\endgroup$

Your Answer

By clicking “Post Your Answer”, you agree to our terms of service and acknowledge you have read our privacy policy.

Not the answer you're looking for? Browse other questions tagged or ask your own question.