0
$\begingroup$

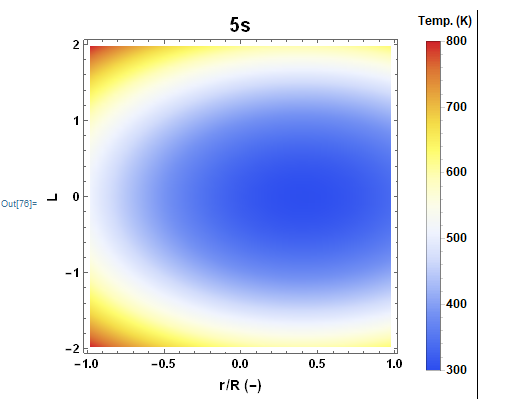
all. I have a problem about the ListDensityPlot. The values shown on the graph do not match the real data. The real data are all above 500K, but it still shows blue. The data list and the plot code are shown here: enter image description here

ListDensityPlot[z1, PlotRange -> All, 
 ColorFunction -> "TemperatureMap", 
 PlotLegends -> 
  BarLegend[{Automatic, {300, 800}}, LegendLabel -> "Temp. (K)"], 
 PlotLabel -> Style["5s", 20], 
 FrameLabel -> {Style["r/R (-)", Bold, FontFamily -> "Helvetica", 
    FontSize -> 14], 
   Style["L", Bold, FontFamily -> "Helvetica", FontSize -> 14]}, 
 LabelStyle -> Directive[Black, Bold, 12]]

enter image description here

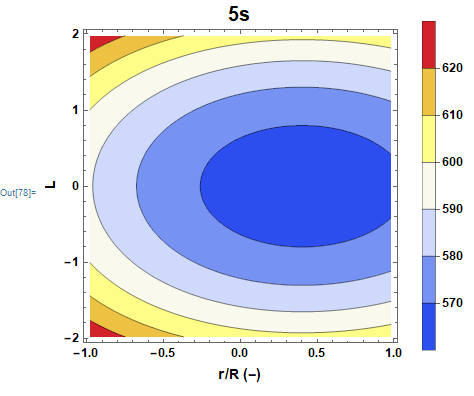
Also, If I use the ListContourPlot, can I specify the range of the legend (from 300 to 800)? Because I want more warm color in the center.

ListContourPlot[z1, ColorFunction -> "TemperatureMap", 
 PlotLegends -> Automatic, PlotLabel -> Style["5s", 20], 
 FrameLabel -> {Style["r/R (-)", Bold, FontFamily -> "Helvetica", 
    FontSize -> 14], 
   Style["L", Bold, FontFamily -> "Helvetica", FontSize -> 14]}, 
 LabelStyle -> Directive[Black, Bold, 12]]
enter image description here thank you very much

$\endgroup$
2
  • 6
    $\begingroup$ Please post actual code, not screenshots of code. :) $\endgroup$
    – ktm
    Commented Aug 27, 2019 at 17:04
  • 1
    $\begingroup$ Sorry, I don't know how to add actual code here. I am trying. $\endgroup$
    – Zoe Z
    Commented Aug 28, 2019 at 9:01

1 Answer 1

1
$\begingroup$

You can define the range the ColorFunction.

Since I don't have the data, I have to make something up.

data = Join @@ 
  Table[{i, j, 300 + 100 i^2 + 100 j^2}, {i, -2, 2, 0.1}, {j, -2, 2, 
    0.1}]
listDensityPlot[min_] := ListDensityPlot[data,
  ColorFunction -> ColorData[{"TemperatureMap", {min, 800}}],
  ColorFunctionScaling -> False,
  PlotLegends -> Range[3, 8] 100,
  PlotRange -> All,
  PlotLabel -> Style["5s", 20], 
  FrameLabel -> {Style["r/R (-)", Bold, FontFamily -> "Helvetica", 
     FontSize -> 14], 
    Style["L", Bold, FontFamily -> "Helvetica", FontSize -> 14]}, 
  LabelStyle -> Directive[Black, Bold, 12]]
listContourPlot[min_] := ListContourPlot[data,
  ColorFunction -> ColorData[{"TemperatureMap", {min, 800}}],
  ColorFunctionScaling -> False,
  PlotLegends -> Range[3, 8] 100,
  PlotRange -> All,
  PlotLabel -> Style["5s", 20], 
  FrameLabel -> {Style["r/R (-)", Bold, FontFamily -> "Helvetica", 
     FontSize -> 14], 
    Style["L", Bold, FontFamily -> "Helvetica", FontSize -> 14]}, 
  LabelStyle -> Directive[Black, Bold, 12]]
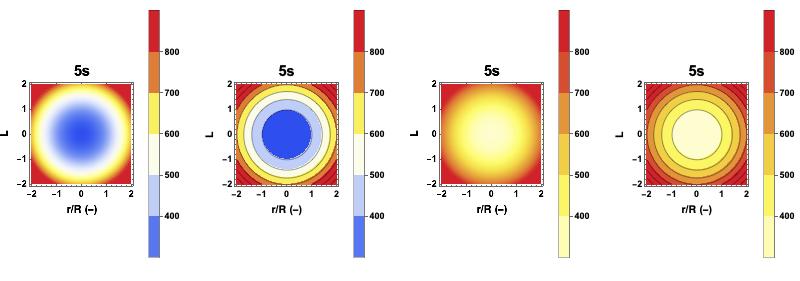
Setting the lower range of ColorFunction to 300, the center of the diagram becomes blue. Changing it to a negative value, e.g. -300, the center becomes yellow.

{listDensityPlot[300], listContourPlot[300], listDensityPlot[-300], 
 listContourPlot[-300]}

enter image description here

$\endgroup$
1
  • $\begingroup$ Thank you very much! This is really helpful! $\endgroup$
    – Zoe Z
    Commented Aug 30, 2019 at 10:27

Your Answer

By clicking “Post Your Answer”, you agree to our terms of service and acknowledge you have read our privacy policy.

Not the answer you're looking for? Browse other questions tagged or ask your own question.