5
$\begingroup$
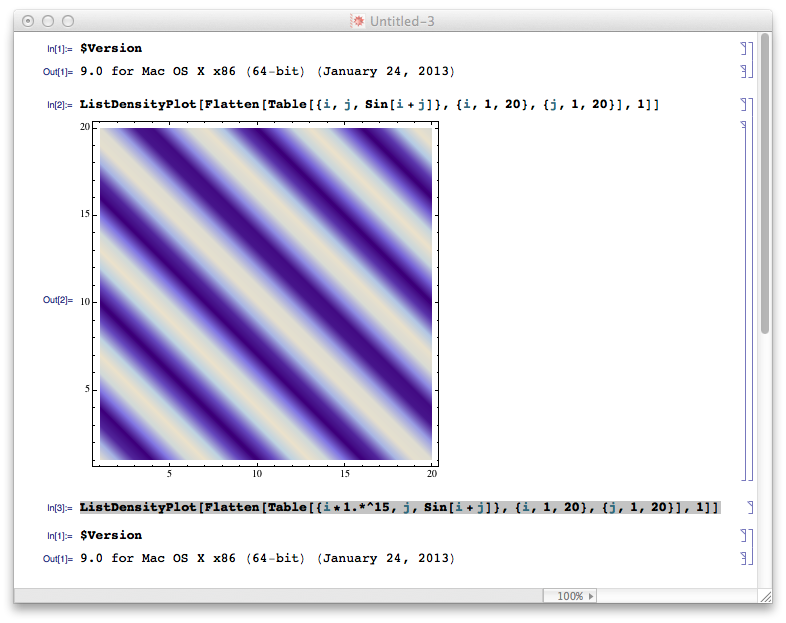
ListDensityPlot[
 Flatten[Table[{i, j, Sin[i + j]}, {i, 1, 20}, {j, 1, 20}], 1]]

gives the expected result, but a linear scale crashes my kernel (please save your work before trying)

ListDensityPlot[
 Flatten[Table[{i*1.*^15, j, Sin[i + j]}, {i, 1, 20}, {j, 1, 20}], 1]]

why? And how to fix it? I'm using OS X 10.9.

Here is the screen crop.
enter image description here

$\endgroup$
11
  • $\begingroup$ Have you written [email protected] about this? $\endgroup$
    – rcollyer
    Commented Oct 26, 2013 at 21:32
  • 1
    $\begingroup$ Same thing happens here. I backed off from the 10^15 and it plotted fine at 10^5 but crashed at 10^7... $\endgroup$
    – bill s
    Commented Oct 26, 2013 at 21:37
  • 1
    $\begingroup$ @xslittlegrass In general, if you have a crash you can reproduce on your machine easily, always report it to Wolfram. Sometimes the issue comes from a very specific configuration of your hardware and still Wolfram should know about it. Btw, on my Ubuntu I have a crash too with your code. $\endgroup$
    – halirutan
    Commented Oct 26, 2013 at 22:21
  • 1
    $\begingroup$ Related to this I think. $\endgroup$ Commented Oct 26, 2013 at 23:39
  • 1
    $\begingroup$ reply from wolfram: "I would like to confirm that you really do want your x-values in the form i*1.*^15 i.e. numbers like 1.*10^15, 2.*10^15 and so on. If this is indeed what you want then I see that Mathematica does have a problem trying to generate a density plot with your array. It seems to be handling x-values upto 1.*10^5 but from 1.*10^6 onwards it is unable to create the plot and crashes.I have alerted the associated development team about this issue and also recorded your contact details in my report. We will keep you posted as and when a resolution becomes available." $\endgroup$ Commented Oct 30, 2013 at 17:42

1 Answer 1

4
$\begingroup$

According to xslittlegrass this reply was received from WRI:

I would like to confirm that you really do want your x-values in the form i*1.*^15 i.e. numbers like 1.*10^15, 2.*10^15 and so on. If this is indeed what you want then I see that Mathematica does have a problem trying to generate a density plot with your array. It seems to be handling x-values up to 1.*10^5 but from 1.*10^6 onwards it is unable to create the plot and crashes. I have alerted the associated development team about this issue and also recorded your contact details in my report. We will keep you posted as and when a resolution becomes available.

$\endgroup$

Your Answer

By clicking “Post Your Answer”, you agree to our terms of service and acknowledge you have read our privacy policy.

Not the answer you're looking for? Browse other questions tagged or ask your own question.