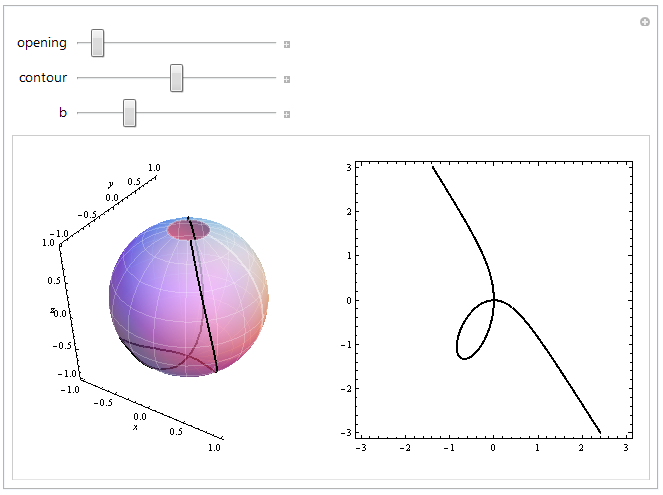
I am currently teaching some students about the "point at infinity", and how it allows us to treat circles and lines as "the same", etc. I would like to kind of show this happening with a series of three images:
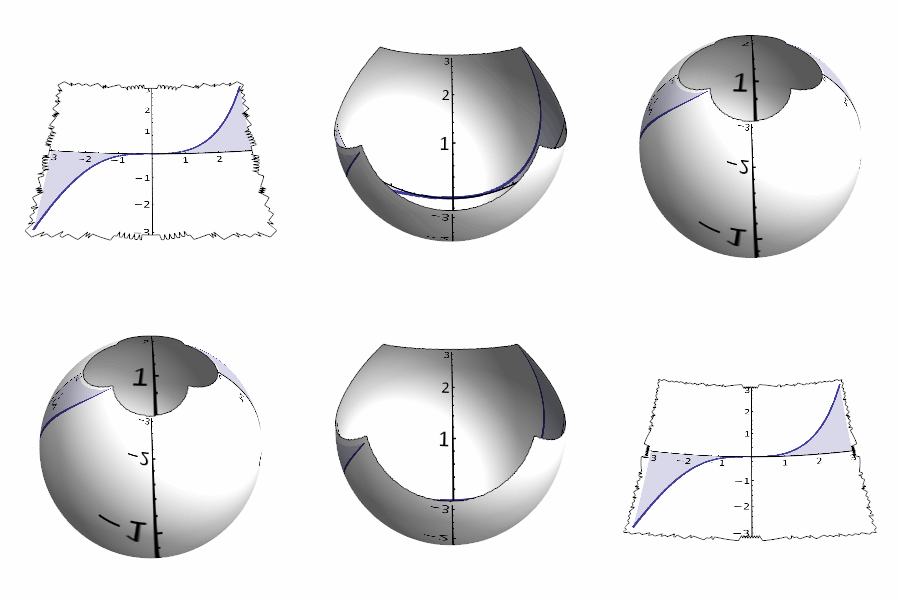
- The usual, $x$-$y$ plane plot of some function (say $y=x^3$)
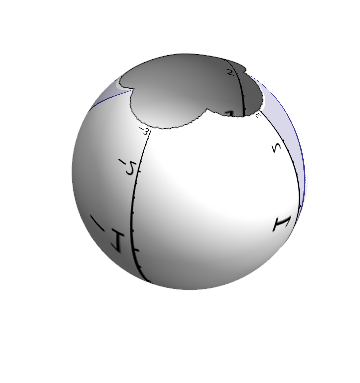
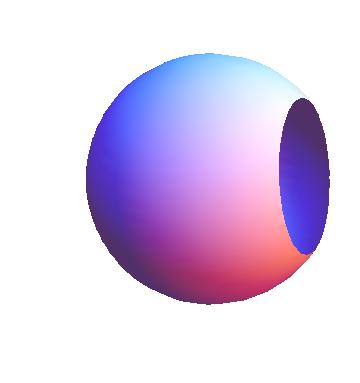
- That plot, on the surface of an incomplete sphere: that is, a sphere with a disk removed (the gluing isn't finished yet).
- The plot on a complete sphere (bonus points if the ends of the cubic join together!)
Now, I have been playing with Texture for the last 90min or so, and while I think I can eventually get it to do what I want for step 3., I don't see how to get it to work for step 2. The problem is, when I do an incomplete sphere (I have been using a RegionFunction), the Texture is distorted by this. In fact, the distortion is quite nasty (I am always completely confused by TextureCoordinates).
Is there a way to do this in a nice way? I am open to any suggestions!
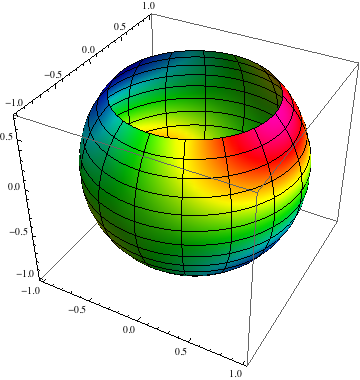
EDIT: here is a picture of what I mean by "incomplete sphere":
2nd EDIT: here is a picture of what I had in mind (for step 3 anyway):
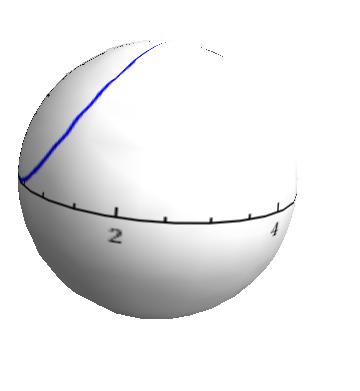
Code:
SphericalPlot3D[1, {theta, 0, Pi}, {phi, 0, 2 Pi},  PlotStyle -> Texture[p],
        TextureCoordinateFunction -> ({#5, 1 - #4} &), Lighting -> "Neutral",
        Mesh -> None, Axes -> False, Boxed -> False]
3rd EDIT: Sorry for the confusion, and multiple edits! When I say "that plot" on the surface of a sphere, I mean the graph, the axes, the tick marks, everything.

