4
$\begingroup$

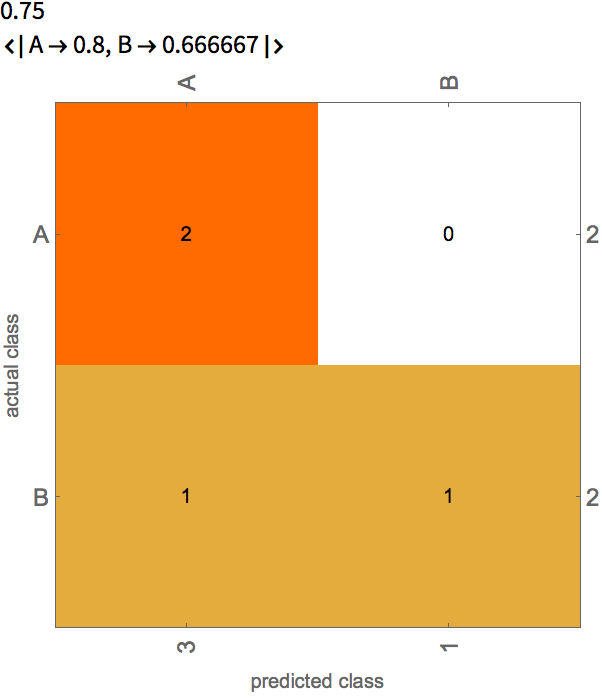
Using ClassifierMeasurementsObject you can plot nice ConfusionMatrix:

enter image description here

But how to mimic this matrix plot from a plain Matrix?

In other terms, from

M={{2,0},{1,1}}
k={"A","B"}

I would like to reproduce the previous plot.

So far I tried:

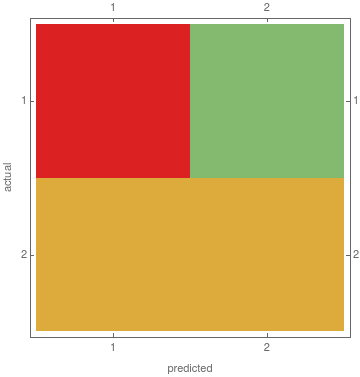
MatrixPlot[M,Frame->True,
             FrameLabel->{"actual","predicted"},
             ColorFunction->"Rainbow"]

enter image description here

but a lot of things are missing.

The most important are:

  • numbers in the plot

  • tick labels (note that they are rotated which is important as I have long names)

$\endgroup$

1 Answer 1

3
$\begingroup$
m = {{2, 0}, {1, 1}};
k = {"A", "B"};
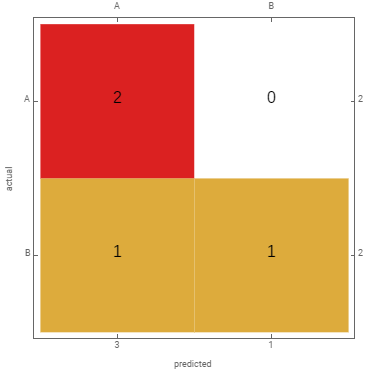
MatrixPlot[m, ColorRules -> {0 -> White}, Frame -> True, 
 FrameLabel -> {"actual", "predicted"}, 
 FrameTicks -> {{MapIndexed[{#2[[1]], #} &, k], 
    MapIndexed[{#2[[1]], #} &, Total@Transpose@m]}, 
   {MapIndexed[{#2[[1]], #} &, Total[m]], 
    MapIndexed[{#2[[1]], #} &, k]}}, 
 ColorFunction -> "Rainbow", 
 Epilog -> MapIndexed[Text[Style[#, 16], #2 - 1/2] &, Transpose@Reverse@m, {2}]]

enter image description here

$\endgroup$
2
  • $\begingroup$ I like this. I included it in the package "ROCFunctions.m"; see this link . $\endgroup$ Commented Jun 12, 2019 at 15:30
  • $\begingroup$ Awesome! Thank you (I just added a Rotate[#,Pi/2] for upper tick labels) $\endgroup$ Commented Jun 12, 2019 at 16:05

Your Answer

By clicking “Post Your Answer”, you agree to our terms of service and acknowledge you have read our privacy policy.

Not the answer you're looking for? Browse other questions tagged or ask your own question.