5
$\begingroup$

I was working on a simple 2D region plot:

RegionPlot[x+0.45y>=122. && y>=76.8 && 83.2<=x<=101.7 && y<=88.6,{x,82,95},{y,76,90},PerformanceGoal->"Quality",ImageSize->Large,LabelStyle->16,FrameLabel->{"x","y"}]

Everything works as expected and gives the following result:
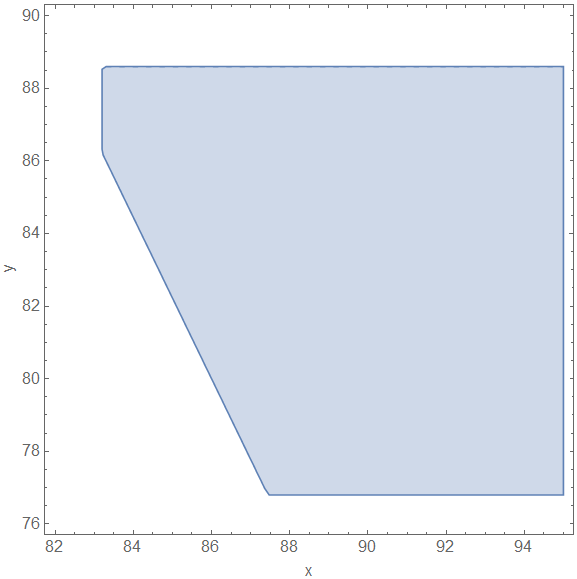
regionplot_2d_1

However, if I add a ColorFunction (I have tried different onces, also from reference), the whole image, including frame labels gets somehow rasterized. This looks quite ugly.

RegionPlot[x+0.45y>=122. && y>=76.8 && 83.2<=x<=101.7 && y<=88.6,{x,82,95},{y,76,90},ColorFunction->Function[{x, y},Norm@{x,y}],PerformanceGoal->"Quality",ImageSize->Large,LabelStyle->16,FrameLabel->{"x","y"}]
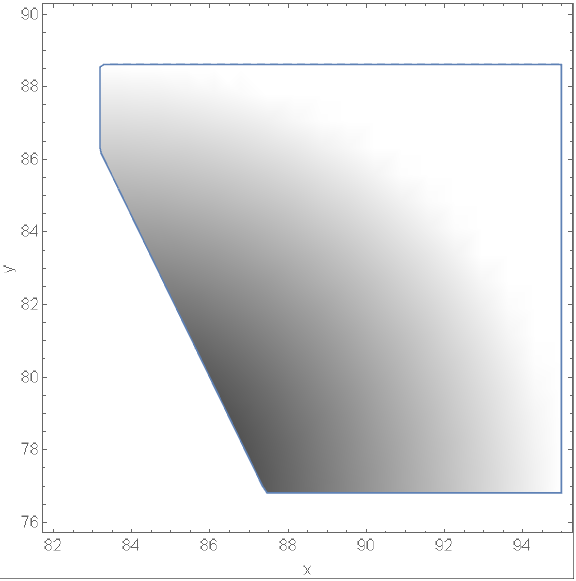
regionplot_2d_2

Can you reproduce it on your system? How can I use ColorFunction and RegionPlot without rasterization? Otherwise, how can I increase the resolution? RegionPlot has no ImageResolution or other similar options.

I am using 10.0 for Microsoft Windows (64-bit) (September 9, 2014)

Thanks a lot!


ADDITIONAL INFO

Meanwhile, I have used

ContourPlot[Norm[{x, y}], {x, 82, 95}, {y, 76, 90}, ColorFunction -> "Rainbow", Contours -> 64, ContourLines -> False, RegionFunction -> Function[{x, y}, x + 0.45*y >= 122. && y >= 76.8 && 83.2 <= x <= 101.7 && y <= 88.6], PerformanceGoal -> "Quality", ImageSize -> Large, LabelStyle -> 16, FrameLabel -> {"x", "y"}, PlotPoints -> 32]

as an interim solution. It produces a good looking graphics object:
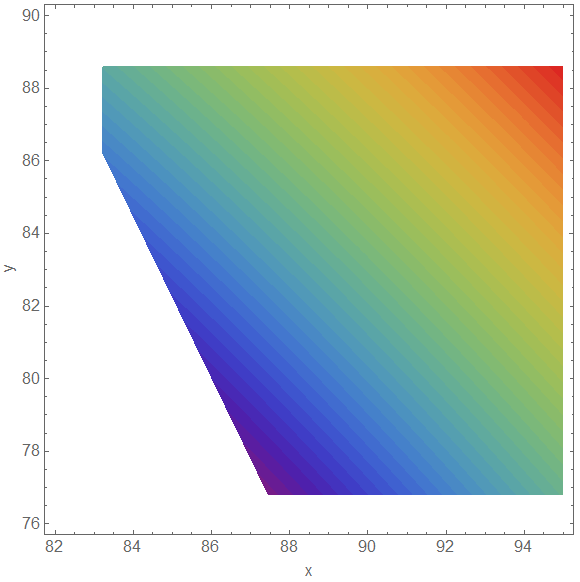
contourplot

$\endgroup$
4
  • 1
    $\begingroup$ I can't reproduce this error. I'm using version 10.0.1.0 on 64-bit Linux and the frame labels look the same in both plots for me. $\endgroup$
    – Jason B.
    Commented Nov 26, 2014 at 11:34
  • $\begingroup$ No problem with v10.0.1 on a Mac OS X 10.10.1 $\endgroup$
    – Bob Hanlon
    Commented Nov 26, 2014 at 13:48
  • $\begingroup$ I can confirm the issue in 10.0.1 on Win8.1 64-bit. $\endgroup$
    – Silvia
    Commented Nov 26, 2014 at 19:59
  • $\begingroup$ Still an issue in 2021 $\endgroup$ Commented Jun 27, 2021 at 20:23

1 Answer 1

2
$\begingroup$

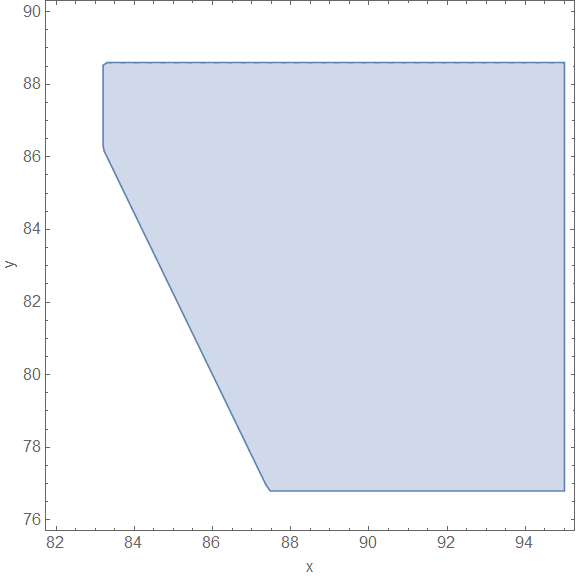
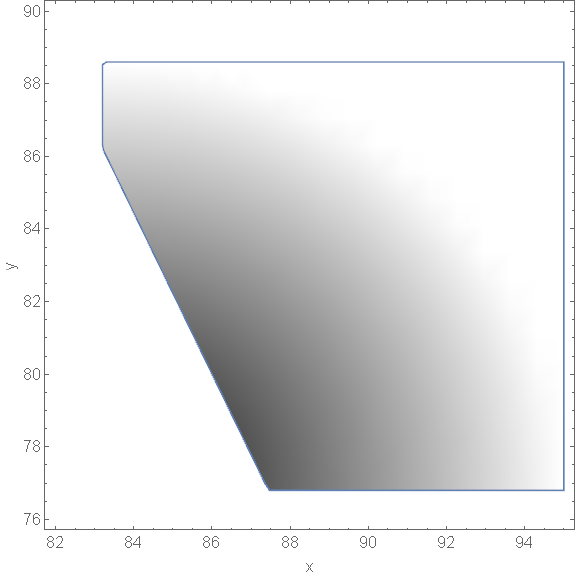
I reproduce what you observe in version 10.0.1 under Win7 x64: the on-screen appearance of the glyphs in tick labels and frame labels changes considerably after addition of ColorFunction (which introduces VertexColors into Graphics generated by RegionPlot). Here is the code I used to check the on-screen appearance:

pl1 = RegionPlot[
  x + 0.45 y >= 122. && y >= 76.8 && 83.2 <= x <= 101.7 && 
   y <= 88.6, {x, 82, 95}, {y, 76, 90}, PerformanceGoal -> "Quality", 
  ImageSize -> Large, LabelStyle -> 16, FrameLabel -> {"x", "y"}]
pl2 = RegionPlot[
  x + 0.45 y >= 122. && y >= 76.8 && 83.2 <= x <= 101.7 && 
   y <= 88.6, {x, 82, 95}, {y, 76, 90}, 
  ColorFunction -> Function[{x, y}, Norm@{x, y}], 
  PerformanceGoal -> "Quality", ImageSize -> Large, LabelStyle -> 16, 
  FrameLabel -> {"x", "y"}]
FlipView[{pl1, pl2}]

Not only the on-screen appearance changes but also Export to raster formats produces different results:

Export["pl1.png", pl1]
Export["pl2.png", pl2]

pl1

pl2

But when I Export the plots as PDFs there is no difference in the appearance of the glyphs:

Export["pl1.pdf", pl1]
Export["pl2.pdf", pl2]

I suggest you to report it to the technical support.

I also confirm that the workaround through switching to ContourPlot works perfectly. The key is that Graphics generated by ContourPlot does not contain VertexColors.

$\endgroup$
2
  • $\begingroup$ Should this be logged as a bug? $\endgroup$
    – 32u-nd
    Commented Nov 26, 2014 at 14:36
  • 1
    $\begingroup$ @akm It is unexpected behavior (the official term used by WRI) and probably should be counted as a borderline bug. $\endgroup$ Commented Nov 26, 2014 at 14:40

Your Answer

By clicking “Post Your Answer”, you agree to our terms of service and acknowledge you have read our privacy policy.

Not the answer you're looking for? Browse other questions tagged or ask your own question.