11
$\begingroup$

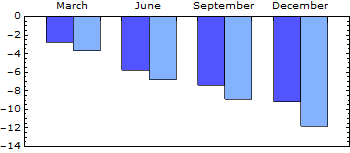
This barchart was tricky to style, and I had to resort to the legacy BarCharts`package. Any ideas how to omit the labels from the bottom edge? Ideally I'd also like separator ticks between the column pairs.

data = {{-2.8, -5.8, -7.4, -9.2}, {-3.7, -6.8, -8.9, -11.8}};

colour1 = RGBColor[82/255, 85/255, 255/255];
colour2 = RGBColor[132/255, 178/255, 255/255];

Quiet[Needs["BarCharts`"]]

BarChart[data, Frame -> True, AxesOrigin -> {0, 0}, 
 PlotRange -> {{0.525, 4.825}, {-14, 0}},
 BarLabels -> {"March", "June", "September", "December"},
 BarGroupSpacing -> 0.3, BarSpacing -> 0, 
 BarStyle -> {colour1, colour2},
 BaseStyle -> {10, FontFamily -> "Verdana"}, AspectRatio -> 0.4, 
 ImageSize -> 350]
enter image description here

$\endgroup$

3 Answers 3

9
$\begingroup$

Just some fun seeing how well I can dial it in by eye:

BarChart[Thread @ data,
 ChartStyle -> {colour1, colour2}, 
 ChartLabels -> {Placed[{"March", "June", "September", "December"}, Above], None},
 Frame -> True,
 FrameTicks -> {False, True}, 
 BaseStyle -> {10, FontFamily -> "Verdana"},
 BarSpacing -> {0, 0.8}, 
 PlotRangePadding -> {0.8, {2.2, 0}},
 AspectRatio -> 0.4, 
 ImageSize -> 350
]

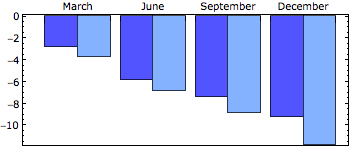
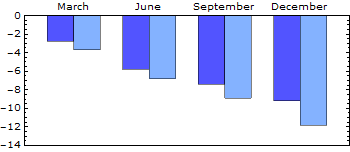
recreation

original

$\endgroup$
10
  • $\begingroup$ That's great, thanks. And with FrameTicks freed up I can add the column separator ticks too, ie: BarChart[Thread@data, ChartStyle -> {colour1, colour2}, ChartLabels -> {Placed[{"March", "June", "September", "December"}, Above], None}, Frame -> True, FrameTicks -> {{True, True}, {False, Map[{#, Null} &, (Range[Length[First@data] - 1]*(2 + 0.8)) - 0.8/2]}}, BaseStyle -> {10, FontFamily -> "Verdana"}, BarSpacing -> {0, 0.8}, PlotRangePadding -> {0.8, {2.2, 0}}, AspectRatio -> 0.4, ImageSize -> 350] $\endgroup$ Commented May 30, 2012 at 10:30
  • $\begingroup$ @Chris Thanks for the Accept. $\endgroup$
    – Mr.Wizard
    Commented May 30, 2012 at 10:37
  • $\begingroup$ I'm curious — did you feel this was significantly different from my answer? I guess I had just forgotten his ImageSize and AspectRatio... $\endgroup$
    – rm -rf
    Commented May 30, 2012 at 13:55
  • $\begingroup$ R.M I didn't intend my answer as complete (and I voted for yours); I just wanted to see how visually close I could get (I didn't actually look at his code for the purpose). FWIW I used BarSpacing, PlotRangePadding. I was hesitant to edit your answer with my messing about. I think your question implies that I should have. Would you have preferred that? Would you still prefer that? $\endgroup$
    – Mr.Wizard
    Commented May 30, 2012 at 17:43
  • 1
    $\begingroup$ @R.M AAaahh! Hypno-Toad! $\endgroup$
    – Mr.Wizard
    Commented May 31, 2012 at 3:59
12
$\begingroup$

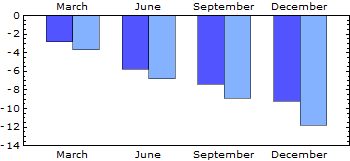
There is no need to use the deprecated BarCharts` package — you can create this chart using only built-in functions:

BarChart[Transpose@data, 
    ChartStyle -> {colour1, colour2}, 
    ChartLabels -> {Placed[{"March", "June", "September", "December"}, Above], None}, 
    Frame -> True, FrameTicks -> {False, True}, 
    BaseStyle -> {10, FontFamily -> "Verdana"}, BarSpacing -> {0, 0.3}, 
    AspectRatio -> 0.4, ImageSize -> 350, PlotRangePadding -> {0.4, 0.1}
]

enter image description here

$\endgroup$
3
  • 1
    $\begingroup$ Adding PlotRange -> {All, {-0.25, -12}} removes the little gap between the boxes and the x-axis. edit: it kills the labels, though, oops. $\endgroup$
    – s0rce
    Commented May 30, 2012 at 3:12
  • $\begingroup$ @ R.M - thanks. It just needed the PlotRangePadding too. $\endgroup$ Commented May 30, 2012 at 12:38
  • $\begingroup$ @ChrisDegnen Thanks, added the PlotRangePadding $\endgroup$
    – rm -rf
    Commented May 30, 2012 at 14:17
8
$\begingroup$

Like the other answers, I also suggest using the new BarChart. If you decide to stick with the BarCharts` package anyway, you can post process the ticks, like this:

Suppose the graphics object is named fig, then

{th, tv} = FrameTicks /. Options[fig, FrameTicks]

(* ==>
 {{{1.175, "March", 0}, {2.175, "June", 0}, 
  {3.175, "September", 0}, {4.175, "December", 0}}, Automatic}
)*

Show[fig, FrameTicks -> {{tv, tv}, {None, th}}]

Mathematica graphics

$\endgroup$
1
  • $\begingroup$ Thanks, that's what I was looking for. $\endgroup$ Commented May 30, 2012 at 10:34

Your Answer

By clicking “Post Your Answer”, you agree to our terms of service and acknowledge you have read our privacy policy.

Not the answer you're looking for? Browse other questions tagged or ask your own question.