4
$\begingroup$

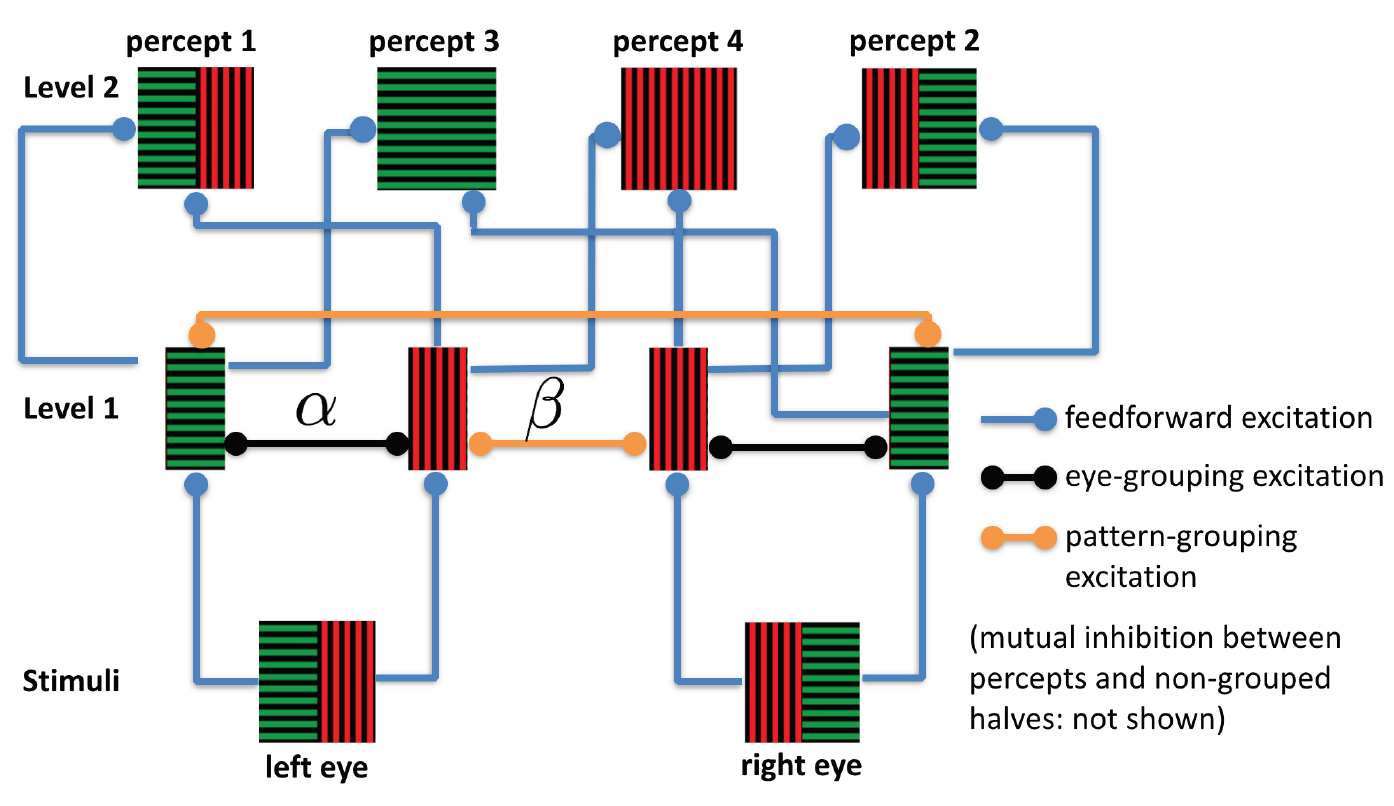
I am trying to reproduce this figure using Mathematica. I am not even sure it is possible. Maybe Graph approach can be used.

enter image description here

Here is my starting point.

greenRed = 
  Graphics[{Rectangle[{0, 0.5}, {17, 16}], Darker@Green, 
    Table[Rectangle[{0, i}, {9, i + 1}], {i, 1, 15, 1.5}], Red, 
    Table[Rectangle[{i + 9.5, 0.5}, {i + 10.5, 16}], {i, 0, 6, 1.5}]},
    AspectRatio -> 1, PlotRangePadding -> None];

redGreen = 
  Graphics[{Rectangle[{0, 0.5}, {17, 16}], Red, 
    Table[Rectangle[{i + 0.5, 0.5}, {i + 1.5, 16}], {i, 0, 6, 1.5}], 
    Darker@Green, 
    Table[Rectangle[{8., i}, {17, i + 1}], {i, 1, 15, 1.5}]}, 
   AspectRatio -> 1, PlotRangePadding -> None];

greenGreen = 
  Graphics[{Rectangle[{0, 0.5}, {17, 16}], Darker@Green, 
    Table[Rectangle[{0, i}, {17, i + 1}], {i, 1, 15, 1.5}]}, 
   AspectRatio -> 1, PlotRangePadding -> None];

redRed = Graphics[{Rectangle[{0, 0.5}, {17, 16}], Red, 
    Table[Rectangle[{i + 0.5, 0.5}, {i + 1.5, 16}], {i, 0, 16, 1.5}]},
    AspectRatio -> 1, PlotRangePadding -> None];

red = Graphics[{Rectangle[{0, 0.5}, {17, 16}], Red, 
    Table[Rectangle[{i + 0.5, 0.5}, {i + 1.5, 16}], {i, 0, 6, 1.5}], 
    White, Rectangle[{8, 0.5}, {17, 16}]}, AspectRatio -> 1];

green = Graphics[{Rectangle[{0, 0.5}, {17, 16}], Darker@Green, 
    Table[Rectangle[{0, i}, {9, i + 1}], {i, 1, 15, 1.5}], White, 
    Rectangle[{9, 0.5}, {17, 16}]}, AspectRatio -> 1];

mat={{0, 0, 1, 1, 0, 0, 0, 0, 0, 0}, {0, 0, 0, 0, 1, 1, 0, 0, 0, 0}, {0, 
  0, 0, 1, 0, 1, 1, 1, 0, 0}, {0, 0, 0, 0, 1, 0, 1, 0, 1, 0}, {0, 0, 
  0, 0, 0, 1, 0, 0, 1, 1}, {0, 0, 0, 0, 0, 0, 0, 1, 0, 1}, {0, 0, 0, 
  0, 0, 0, 0, 0, 0, 0}, {0, 0, 0, 0, 0, 0, 0, 0, 0, 0}, {0, 0, 0, 0, 
  0, 0, 0, 0, 0, 0}, {0, 0, 0, 0, 0, 0, 0, 0, 0, 0}};
AdjacencyGraph[mat, 
 VertexShape -> {1 -> greenRed, 2 -> redGreen, 3 -> green, 4 -> red, 
   5 -> red, 6 -> green, 7 -> greenRed, 8 -> greenGreen, 9 -> redRed, 
   10 -> redGreen}, VertexSize -> 0.5]

I don't know how to plot flow lines. Any suggestion?

$\endgroup$
2
  • 4
    $\begingroup$ "I am not even sure it is possible." It is certainly possible. Anything can be built from graphics primitives. But Mathematica is not the right tool for this. You could make this in yEd ten times faster. $\endgroup$
    – Szabolcs
    Commented Jun 6, 2019 at 8:17
  • $\begingroup$ @Szabolcs thanks for the graph editor. I'll take a look. $\endgroup$ Commented Jun 6, 2019 at 17:18

1 Answer 1

11
$\begingroup$
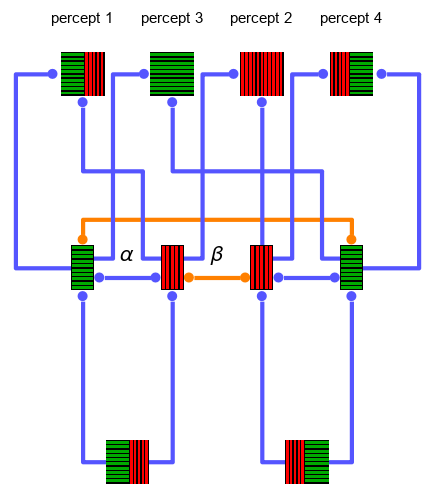
AdjacencyGraph[mat, ImagePadding -> 40, VertexSize -> 0.5, 
  VertexShape -> vshapes, EdgeLabels -> elabels, 
  VertexLabels -> vlabels, EdgeShapeFunction -> edgeshapefuncs, 
  VertexCoordinates -> vcoords, ImageSize -> 400]

enter image description here

where vshapes, elabels, vlabels, edshapefunctions and vcoords are defined below.

First, shapes red and green are modified to remove the white parts:

red2 = Graphics[{Red, Table[Rectangle[{i + 0.5, 0.5}, {i + 1.5, 16}], {i, 0, 6, 1.5}]}, 
   AspectRatio -> 2, Background -> Black];
green2 = Graphics[{Darker@Green, Table[Rectangle[{0, i}, {9, i + 1}], {i, 1, 15, 1.5}]}, 
   AspectRatio -> 2, Background -> Black];

vshapes = MapIndexed[#2[[1]] -> # &, {greenRed, redGreen, green2, red2, red2, 
    green2, greenRed, greenGreen, redRed, redGreen}];

Vertex and edge labels are straightforward:

vlabels = MapThread[# -> Placed[Style["percept " <> #2, 14], Above] &, 
  {{7, 8, 9, 10}, {"1", "3", "2", "4"}}];
elabels = {DirectedEdge[3, 4] -> Placed[Style["α", 20], {1/2, {1/2, 0}}], 
   DirectedEdge[4, 5] -> Placed[Style["β", 20], {1/2, {1/2, 0}}]};

We get the vertex layout by transforming GraphEmbedding[CompleteGraph[{2, 4, 4}]]:

vcoords = ScalingTransform[{-1, 1}]@
   RotationTransform[Pi/2][GraphEmbedding[CompleteGraph[{2, 4, 4}]]];
vcoords[[{1, 2}]] = ScalingTransform[{2, 1}][vcoords[[{1, 2}]]];

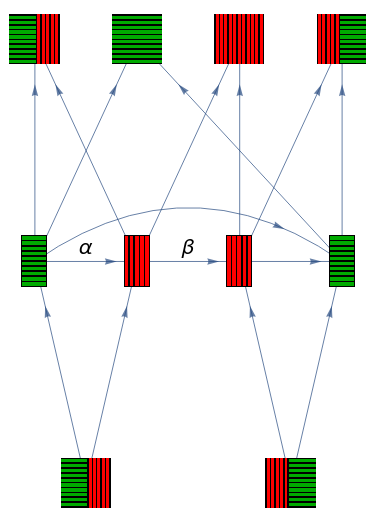
Finally we make edge 3 -> 6 curved to avoid edge overlaps

AdjacencyGraph[mat, ImagePadding -> 40, VertexSize -> 0.5, 
 VertexShape -> vshapes, EdgeLabels -> elabels, 
 VertexLabels -> vlabels, VertexCoordinates -> vcoords, ImageSize -> 400, 
 EdgeShapeFunction -> {DirectedEdge[3, 6] -> {"CurvedEdge", "Curvature" -> .7}}]

enter image description here

Getting the edge shapes and layout is manual:

ClearAll[dotArrow]
dotArrow[setback_: {.06, .06}, color_: Lighter[Blue]] := {Thickness[.01], Opacity[1], 
  color, JoinForm["Round"], (GraphElementData["DotLine"][##]/. BezierCurve->Line)  /. 
    {Arrowheads[{{a_, b_, {c_, d_}}}] :> Arrowheads[{{a, 1, {c, d}}, {-a, 0, {c, d}}}], 
     Arrow[x_] :> Arrow[x, setback]}} &

edgeshapefuncs = {_ :> (dotArrow[][{1, .95} # & /@ #[[{1, -1}]], ##2]&),
   DirectedEdge[1, 4] | DirectedEdge[2, 5] | DirectedEdge[5, 9] :> dotArrow[ {0, .12}],
   DirectedEdge[4, 5] -> (dotArrow[.06, Orange][{1, .95} # & /@ #[[{1, -1}]], ##2] &),
   DirectedEdge[3, 6] -> (dotArrow[.12, Orange][{#[[1]], {#[[1, 1]], 1.25 #[[1, 2]]}, 
      {#[[2, 1]], 1.25 #[[2, 2]]}, #[[-1]]}, ##2] &),
   DirectedEdge[3, 7] | DirectedEdge[6, 10] :> 
     (dotArrow[{0, .06}][{#[[1]], {1.5 #[[1, 1]], #[[1, 2]]}, {1.5 #[[2, 1]], #[[2, 2]]},
        {1.1, 1} #[[-1]]}, ##2] &),
   DirectedEdge[1, 3] | DirectedEdge[1,4]|DirectedEdge[2,5]|DirectedEdge[2, 6] :>       
     (dotArrow[{0, .12}][{#[[1]], {#[[2, 1]], #[[1, 2]]}, #[[-1]]}, ##2] &),
   DirectedEdge[3, 8] | DirectedEdge[5, 10] | DirectedEdge[4, 9] :> 
     (dotArrow[ {0, .12}][{{1, 1.05} #[[1]], 
        {2/3 #[[1, 1]] + 1/3 #[[-1, 1]], 1.05 #[[1, 2]]}, 
        {2/3 #[[1, 1]] + 1/3 #[[-1, 1]], #[[2, 2]]}, #[[-1]]}, ##2] &),
   DirectedEdge[4, 7] :> (dotArrow[ {0, .12}][{{1, 1.05} #[[1]], 
        {2/3 #[[1, 1]] + 1/3 #[[-1, 1]], 1.05 #[[1, 2]]},
        {2/3 #[[1, 1]] + 1/3 #[[-1, 1]],  Mean[#[[{1, -1}, 2]]]},
        {#[[2, 1]], Mean[#[[{1, -1}, 2]]]}, #[[-1]]}, ##2] &),
   DirectedEdge[6, 8] :> (dotArrow[ {0, .12}][{{1, 1.05} #[[1]],
        {5/6 #[[1, 1]] + 1/6 #[[-1, 1]], 1.05 #[[1, 2]]}, 
        {5/6 #[[1, 1]] + 1/6 #[[-1, 1]], Mean[#[[{1, -1}, 2]]]}, 
        {#[[2, 1]], Mean[#[[{1, -1}, 2]]]}, #[[-1]]}, ##2] &)};
$\endgroup$
5
  • 3
    $\begingroup$ @Okkes, now it works in v12 (wolfram Cloud). The issue was that, in version 12, the built-in function GraphElementData["DotLine"] produces BezierCurves when its first argument has more than 2 points. Replacing BezierCurve with Line fixed the issue. $\endgroup$
    – kglr
    Commented Jun 7, 2019 at 5:24
  • $\begingroup$ Thanks kglr. One more request. How to connect 1-4 and 2-5 from the side as in the original figure? I could not figure it out. $\endgroup$ Commented Jun 7, 2019 at 12:45
  • $\begingroup$ @OkkesDulgerci, please see the new version. $\endgroup$
    – kglr
    Commented Jun 7, 2019 at 13:39
  • $\begingroup$ Excellent!! Bottom 2 vertices seem too far from Level 1. Is it possible to shorten? $\endgroup$ Commented Jun 7, 2019 at 13:43
  • 1
    $\begingroup$ @Okkes, try SetProperty[ag, {VertexCoordinates->{v:(1|2) :> TranslationTransform[{0, .5}] @ ScalingTransform[{2, 1}][PropertyValue[{ag, v}, VertexCoordinates]]}}] in the last line. $\endgroup$
    – kglr
    Commented Jun 7, 2019 at 13:49

Your Answer

By clicking “Post Your Answer”, you agree to our terms of service and acknowledge you have read our privacy policy.

Not the answer you're looking for? Browse other questions tagged or ask your own question.