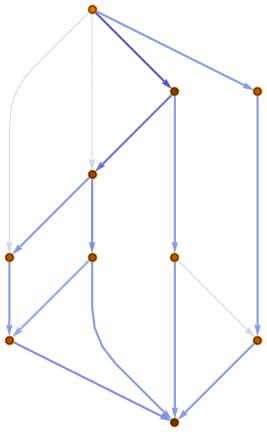
I want to calculate the maximum flow of the network and am attempting to do that with FindMaximumFlow[edge capacity matrix, s, t, "OptimumFlowData"], which in my case is
F = FindMaximumFlow[({
{0, 2, 2, 2, 10, 0, 0, 0, 0, 0},
{0, 0, 0, 0, 0, 2, 0, 0, 0, 0},
{0, 2, 0, 0, 0, 0, 6, 0, 0, 0},
{0, 0, 0, 0, 0, 0, 0, 2, 0, 0},
{0, 0, 6, 0, 0, 0, 0, 0, 2, 0},
{0, 0, 0, 0, 0, 0, 0, 0, 0, 5},
{0, 0, 0, 0, 0, 1, 0, 0, 0, 2},
{0, 0, 0, 0, 0, 0, 0, 0, 0, 2},
{0, 0, 0, 0, 0, 0, 0, 4, 0, 6},
{0, 0, 0, 0, 0, 0, 0, 0, 0, 0}
}), 1, 10, "OptimumFlowData" ].
While I do get a result with this, I want to be able to use the command F["FlowGraph"] to get a network showing the optimal solution.
Here you can see that by this command the optimal graph is returned when the first parameter is the graph itself instead of the edge capacity matrix.
How can I get the optimal graph from using FindMaximumFlow with the capacity matrix or get the graph from the edge capacity matrix so I can use the graph similarly to how it's used in the example in documentation? Thank you!

