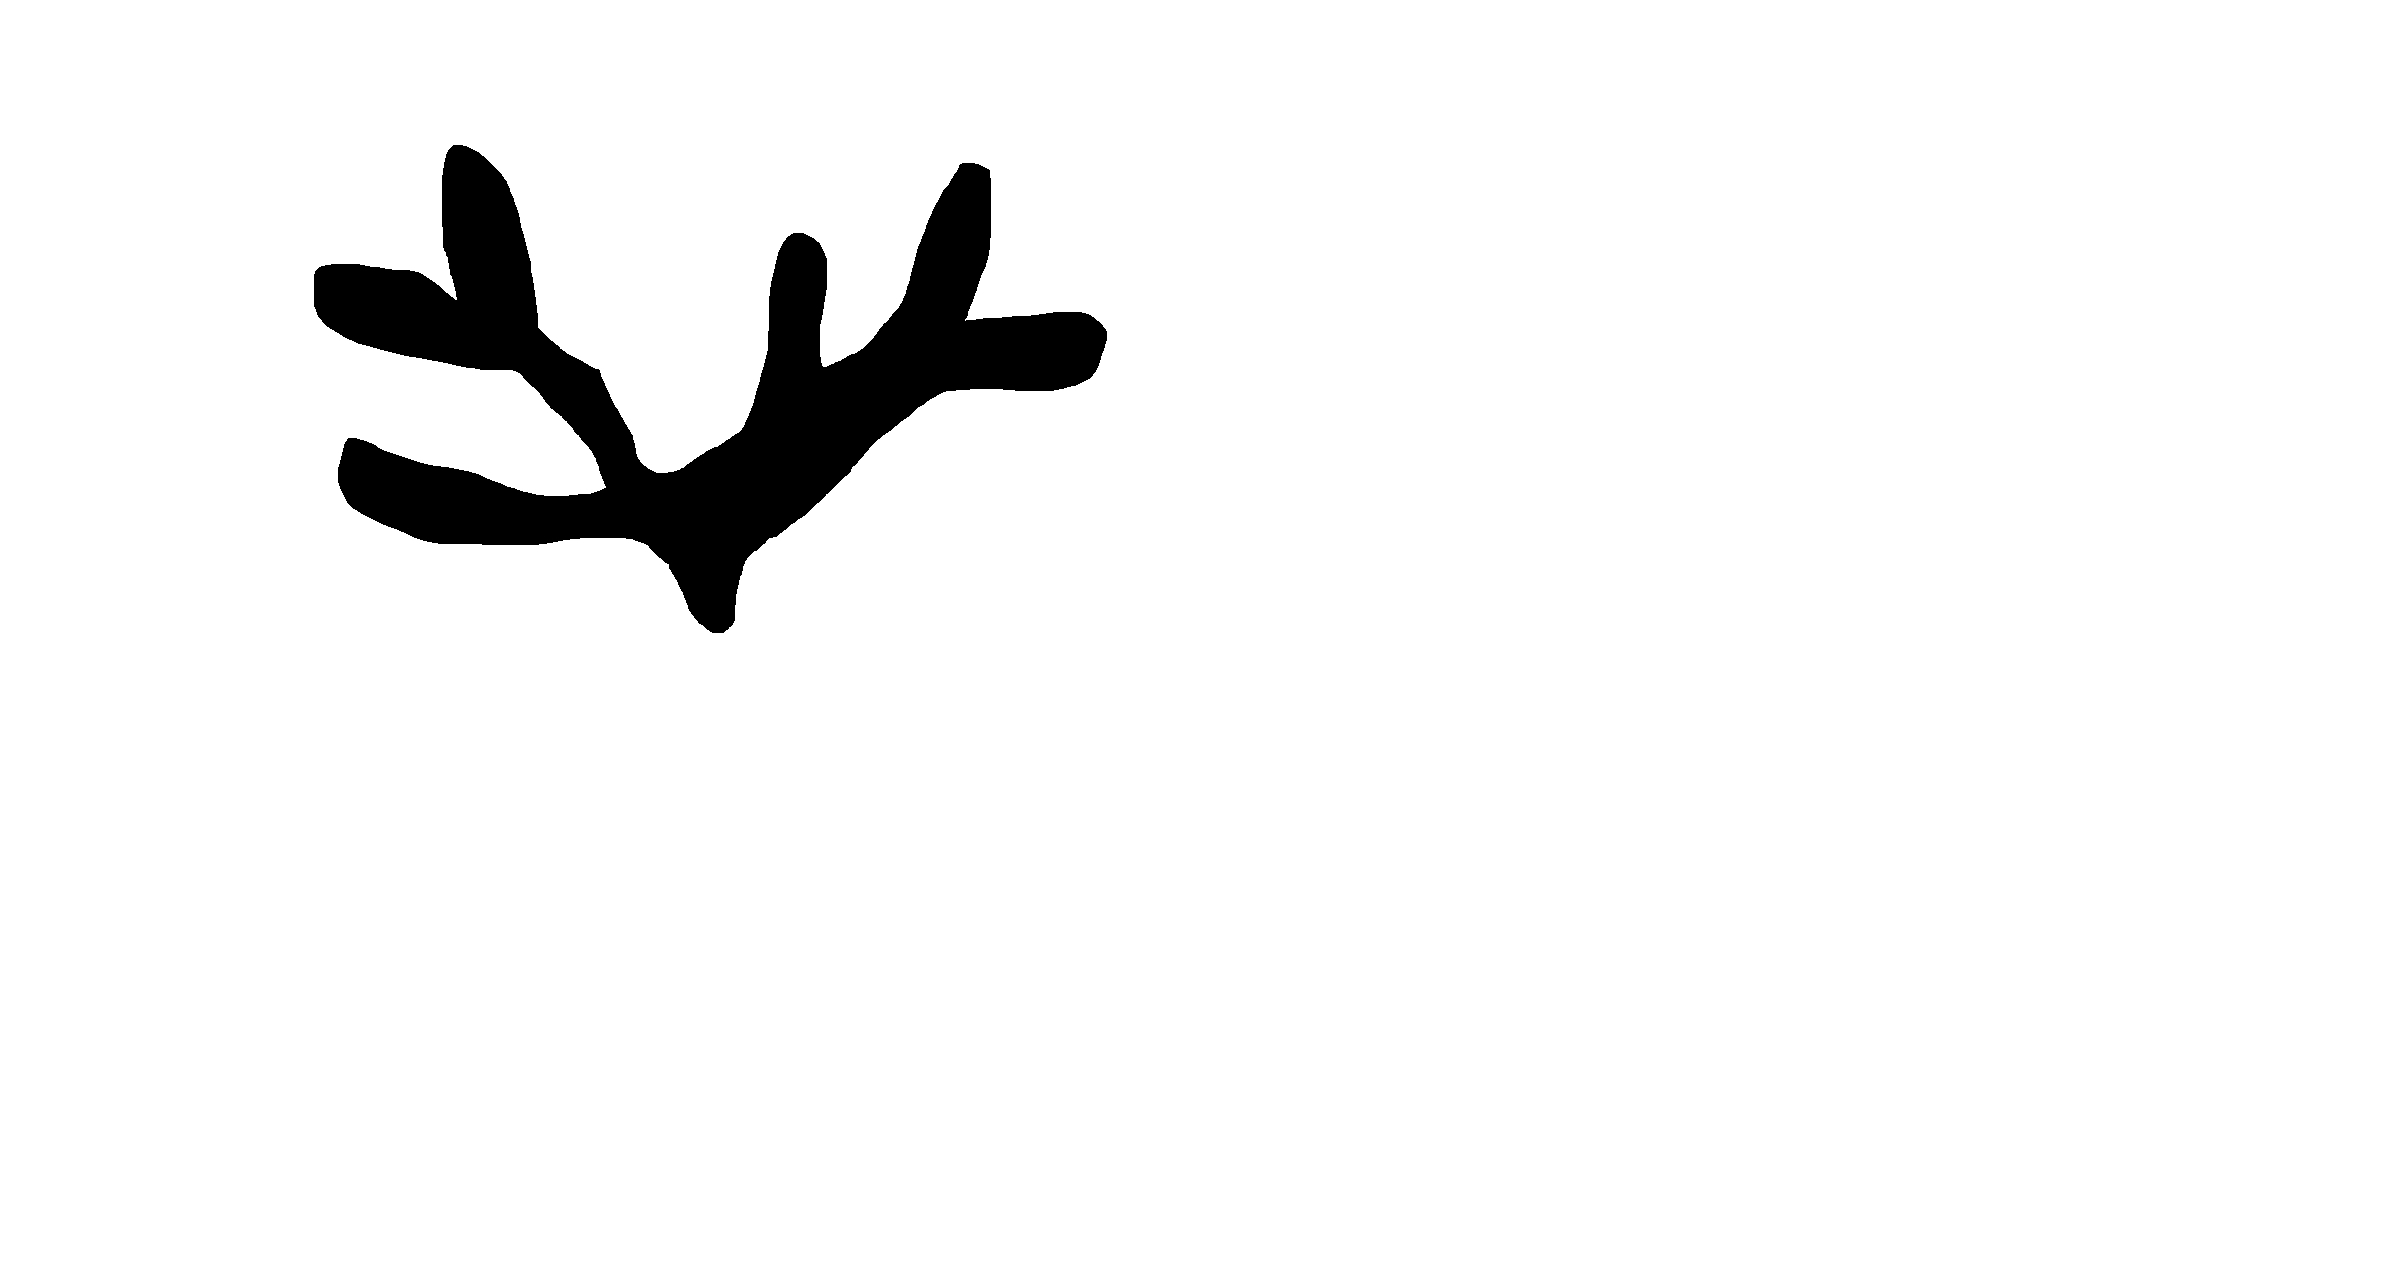
If you're flexible on how you want to measure the edge width in the doodle, you can use one of the available properties in ComponentMeasurements after splitting the thinned image into segments used for the graph.
For easier visualization I used a smaller version of the image:
img = Binarize@ImageResize[doodle, 300]
The doodle doesn't have any noise, so there's no need to fill in holes, e.g., with Closing or FillingTransform functions.
The thin image used to make the graph:
imgThin = Thinning[ColorNegate[img]]
Find and remove the branch points in the thin image, to separate the segments corresponding to each graph edge:
segments = ImageMultiply[imgThin, ColorNegate@Dilation[MorphologicalBranchPoints[imgThin], 4]]
Identify parts of the original image associated with each of these segments
components = WatershedComponents[img, segments];
Restrict the components to the part of the image defining the graph:
components = ImageData[ColorNegate@img] components;
Measure the width of each component. ComponentMeasurements has several measurements of component size, such as "EquivalentDiskRadius", the smaller of the "SemiAxes" of ellipse approximations to the segments, the largest distance to the perimeter "MaxPerimeterDistance", and the width of bounding boxes obtained with "MinimalBoundingBox". All these except the bounding box width are measures of half the width, e.g., radius instead of diameter. For example,
componentSizes = ComponentMeasurements[components, "MaxPerimeterDistance", "ComponentAssociation"]

<|1 -> 13.3417, 2 -> 11.6619, 3 -> 11.1803, 4 -> 13.9284, 5 -> 9.84886, 6 -> 13., 7 -> 13.8924, 8 -> 17.6918, 9 -> 13., 10 -> 9.21954, 11 -> 10.7703|>
In this case, the ordering of edges from MorphologicalGraph is the same as the ordering of components from ComponentMeasurements. I don't know if this is true in general. If not, there's more work to get the end points of the edges, from the VertexCoordinate property, and end points of each segment. Then match edges and segments with the nearest end points to know which edge each of these width values goes with.
These width measurements correspond to the edges in the graph.
EdgeList[graph]

{1 \[UndirectedEdge] 5, 2 \[UndirectedEdge] 6, 3 \[UndirectedEdge] 8, 4 \[UndirectedEdge] 5, 5 \[UndirectedEdge] 10, 6 \[UndirectedEdge] 7,  6 \[UndirectedEdge] 8, 8 \[UndirectedEdge] 11,  9 \[UndirectedEdge] 10, 10 \[UndirectedEdge] 11,  11 \[UndirectedEdge] 12}
If you're also interested in the lengths of the edges in the image, note the MorphologicalGraph includes the length in the edge weight property of the graph:
PropertyValue[graph, EdgeWeight]

{51, 52, 57, 44, 65, 49, 38, 36, 96, 23, 28}

