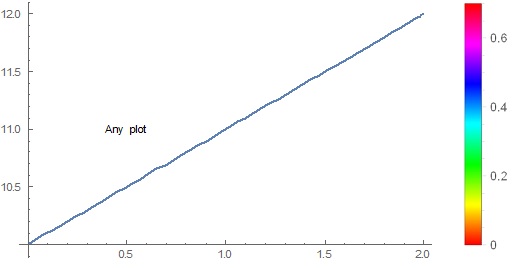
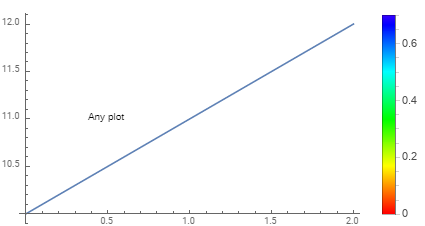
I created a simple barlegend:
barlegend = BarLegend[{Hue[#] &, {0, .7}}]
However, when I tried placing this legend next to any plot, the legend appears differently. It seems that when placed in a plot, my custom range [0, 0.7] is scaled to [0,1] as input for the Hue function. How could I make the legend appear in the same way as it is created? Thank you.
barlegend = BarLegend[{Hue[#] &, {0, .7}}]

Plot[t + 10, {t, 0, 2}, PlotLegends -> barlegend,
 Epilog -> Text["Any plot", {.5, 11}]]


