5
$\begingroup$

I am trying to overlap two Graphics objects g1 and g2 with Show. However, I found that when the coordinates of each object is defined to quite different ranges, I need to "scale" and "shift" the coordinates of one object to get the desired look.

For example,

g1 = Graphics[{GrayLevel[0.8], Rectangle[{-2, -2}, {2, 2}]}];
g2 = Graphics[{{GrayLevel[0.5], Rectangle[{0, 0}, {1, 1}]}}];
Show[g1, AspectRatio -> 1, Axes -> True, ImageSize -> 230]
Show[g2, AspectRatio -> 1, Axes -> True, ImageSize -> 230]
Show[g1, g2, AspectRatio -> 1, Axes -> True, ImageSize -> 230]

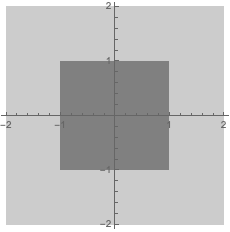
The overlapped version of g1 and g2 looks like this enter image description here

However, I would like to scale the coordinates of g2 to make g2 twice large and also shift its coordinates so the center can "roughly" coincide the center of g1. I say "roughly" because g1 and g2 may be some graphics not of a regular shape. The desired result will look like enter image description here
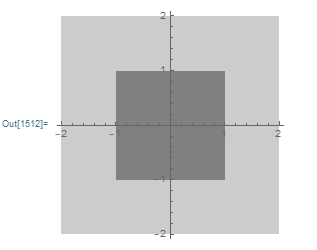
So how can I manipulate the coordinates of g2 to adjust its relative position and size when Show with g1? Please avoid modifying the definition of g1 and g2 as they can be any Graphics copy-pasted over.

$\endgroup$

2 Answers 2

6
$\begingroup$

You can use Scale on First @ g2 (which contains the graphics directives and primitives):

Show[g1, Graphics @ Scale[First @ g2, 2, {1, 1}], AspectRatio -> 1, 
 Axes -> True, ImageSize -> 230]

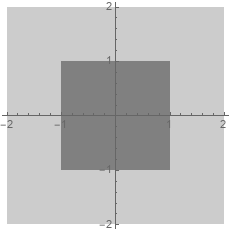
enter image description here

Alterantively, you can use combination of Scale and Translate:

Show[g1, Graphics @ Translate[Scale[First @ g2, 2], -{1, 1}/2], 
 AspectRatio -> 1, Axes -> True, ImageSize -> 230]

or

Show[g1, Graphics@Translate[Scale[First@g2, 2, {0, 0}], -{1, 1}], 
 AspectRatio -> 1, Axes -> True, ImageSize -> 230]

same picture

$\endgroup$
4
  • $\begingroup$ Thanks @kglr for the answer. Could you explain how the second argument of Translate is determined? Why it is -{1, 1}/2 instead of -{1, 1}? $\endgroup$
    – nanjun
    Commented May 16, 2019 at 20:07
  • 1
    $\begingroup$ @nanjun, if you use Scale[First@g2, 2, {0, 0}] (with the third argument specifying the point that is kept fixed) you can use -{1,1} instead of -{1,1}/2) , that is, you can use Show[g1, Graphics@Translate[Scale[First@g2, 2, {0, 0}], -{1, 1}], AspectRatio -> 1, Axes -> True, ImageSize -> 230] $\endgroup$
    – kglr
    Commented May 16, 2019 at 20:33
  • 1
    $\begingroup$ ... since Scale[First@g2, 2] fixes the center ({1/2,1/2}) the origin of the rectangle is already shifted by -{1/2,1/2} before Translate is applied. (Compare Show[g1, Graphics@Scale[First@g2, 2], AspectRatio -> 1, Axes -> True, ImageSize -> 230] and Show[g1, Graphics@Scale[First@g2, 2, {0,0}], AspectRatio -> 1, Axes -> True, ImageSize -> 230] $\endgroup$
    – kglr
    Commented May 16, 2019 at 20:37
  • $\begingroup$ Thank you @kglr for the explanation, which was very clear. $\endgroup$
    – nanjun
    Commented May 16, 2019 at 20:44
2
$\begingroup$

I'm not saying that this is what you need for your problem, but sometimes when you want to superimpose graphics like this, you're looking for Inset:

Show[
 g1,
 Graphics@Inset[
   Show[g2, PlotRangePadding -> 0],
   {0, 0}, {Center, Center}, {2, 2}
   ],
 Axes -> True, ImageSize -> 230
 ]

Mathematica graphics

$\endgroup$

Your Answer

By clicking “Post Your Answer”, you agree to our terms of service and acknowledge you have read our privacy policy.

Not the answer you're looking for? Browse other questions tagged or ask your own question.