I often use a version of @Rahul's myStreamPlot (original here) to make nice looking StreamPlots. Briefly, it rescales the axes to achieve a more even distribution of streams.
Options[myStreamPlot] = Options[StreamPlot];
myStreamPlot[f_, {x_, x0_, x1_}, {y_, y0_, y1_}, opts : OptionsPattern[]] :=
Module[{u, v, a = OptionValue[AspectRatio]},
  Show[StreamPlot[{1/(x1 - x0), a/(y1 - y0)} (f /. {x -> x0 + u (x1 - x0), y -> y0 + v/a (y1 - y0)}), {u, 0, 1}, {v, 0, a}, opts]
  /. Arrow[pts_] :> Arrow[({x0, y0} + {x1 - x0, (y1 - y0)/a} #) & /@ pts], PlotRange -> {{x0, x1}, {y0, y1}}]]
Unfortunately any RegionFunction option doesn't get rescaled. For example,
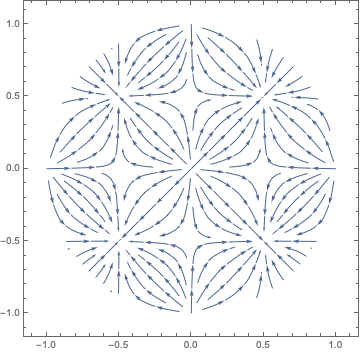
StreamPlot[{Sin[2 π x], Sin[2 π y]}, {x, -1, 1}, {y, -1, 1},
  RegionFunction -> Function[{x, y, vx, vy, n}, x^2 + y^2 < 1]]

looks good while
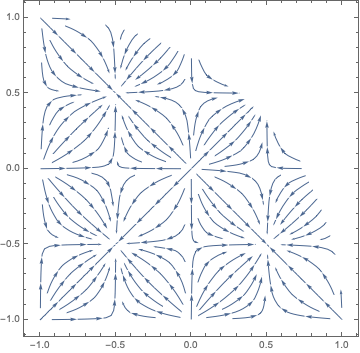
myStreamPlot[{Sin[2 π x], Sin[2 π y]}, {x, -1, 1}, {y, -1, 1},
  RegionFunction -> Function[{x, y, vx, vy, n}, x^2 + y^2 < 1]]

doesn't.
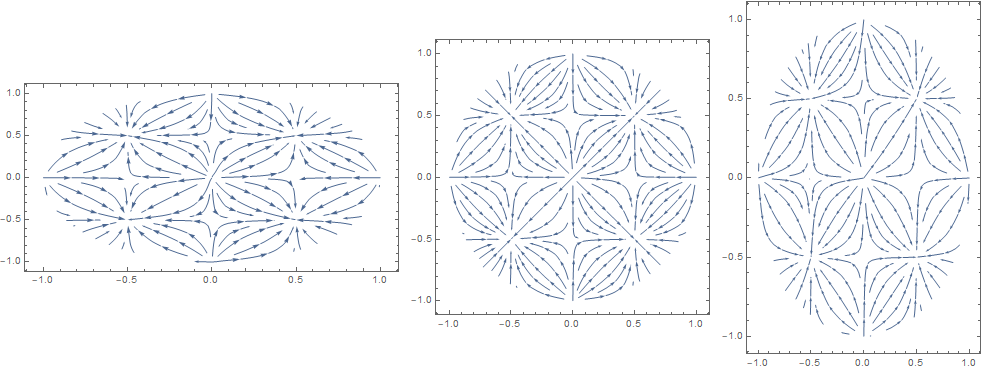
Could someone suggest a way to rescale the RegionFunction inside myStreamPlot to deal with this issue? I tried myself but couldn't figure out how to modify it.


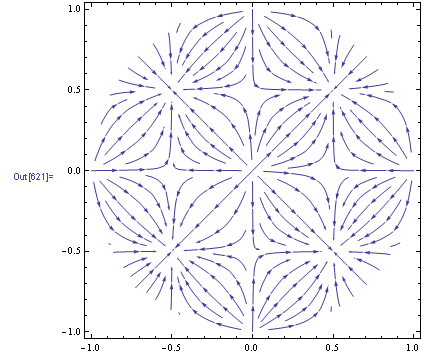
RegionFunction -> Function[{x, y, vx, vy, n}, Rescale[x, {0, 1}, {-1, 1}]^2 + Rescale[y, {0, 1}, {-1, 1}]^2 < 1]give the desired result? $\endgroup$