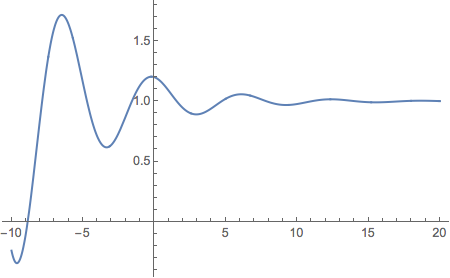
Let me start by saying this is NOT one of a thousand duplicates of the function not showing up on the plot. Mathematica has been working fine for the last 2 years, and then all of a sudden, Plot stopped showing anything at all. Here is a picture of what I'm on about.
If I then type Show[%1, ImageSize -> Medium], the plot sometimes shows up as usual, but it doesn't always work, and even if it did (call me spoiled), I don't really want to have to do that every time I need a plot.
Here's the play-by-play of what happened:
- I was doing homework, plots were fine.
- Mathematica 11.1 crashed.
- I opened it back up, and angrily went to settings to configure autosave
- When I tried to plot again, it wouldn't show up.
- I reset default settings, still broken.
- I uninstalled and updated to v11.3, still broken.
- I rebooted my computer, still broken.
- I made an account here, and am now begging for your help.
Honestly, what has baffled me most of all is number 6. How can the problem persist after uninstalling and reinstalling a different version?
One more thing that may be useful (or may not), here's the first cell that it broke on:
γ[τ_] := 2/Δω E^(-(2/Δω + I ω0) τ)
sig[τ_] := 1 + Re[γ[τ]]
Plot[sig[τ] /. {Δω -> 0.1, ω0 -> 1}, {τ, -100, 100}]
I don't think there's anything too unconventional in there, but maybe I'm missing something. Using the Show[%, ImageSize -> Medium] method here doesn't work.
Anyway, please help.
Update: The problem is happening with any graph I try to plot, not exclusively the two examples that I've shown. Also, I've tested a few different things and it's not just Plot. It does the same thing with any type of plot (LogPlot, ListPlot, etc) as well as any type of Graphics.


LogPlot[sig[\[Tau]] /. {\[CapitalDelta]\[Omega] -> 1/10, \[Omega]0 -> 1}, {\[Tau], -100, 0}].Plotapparently chokes on trying to deal with this range of values. $\endgroup$