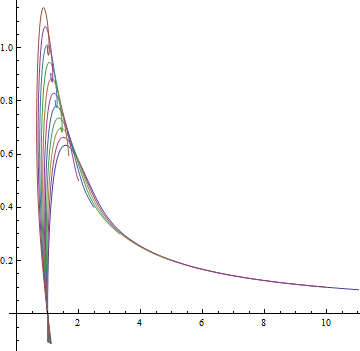
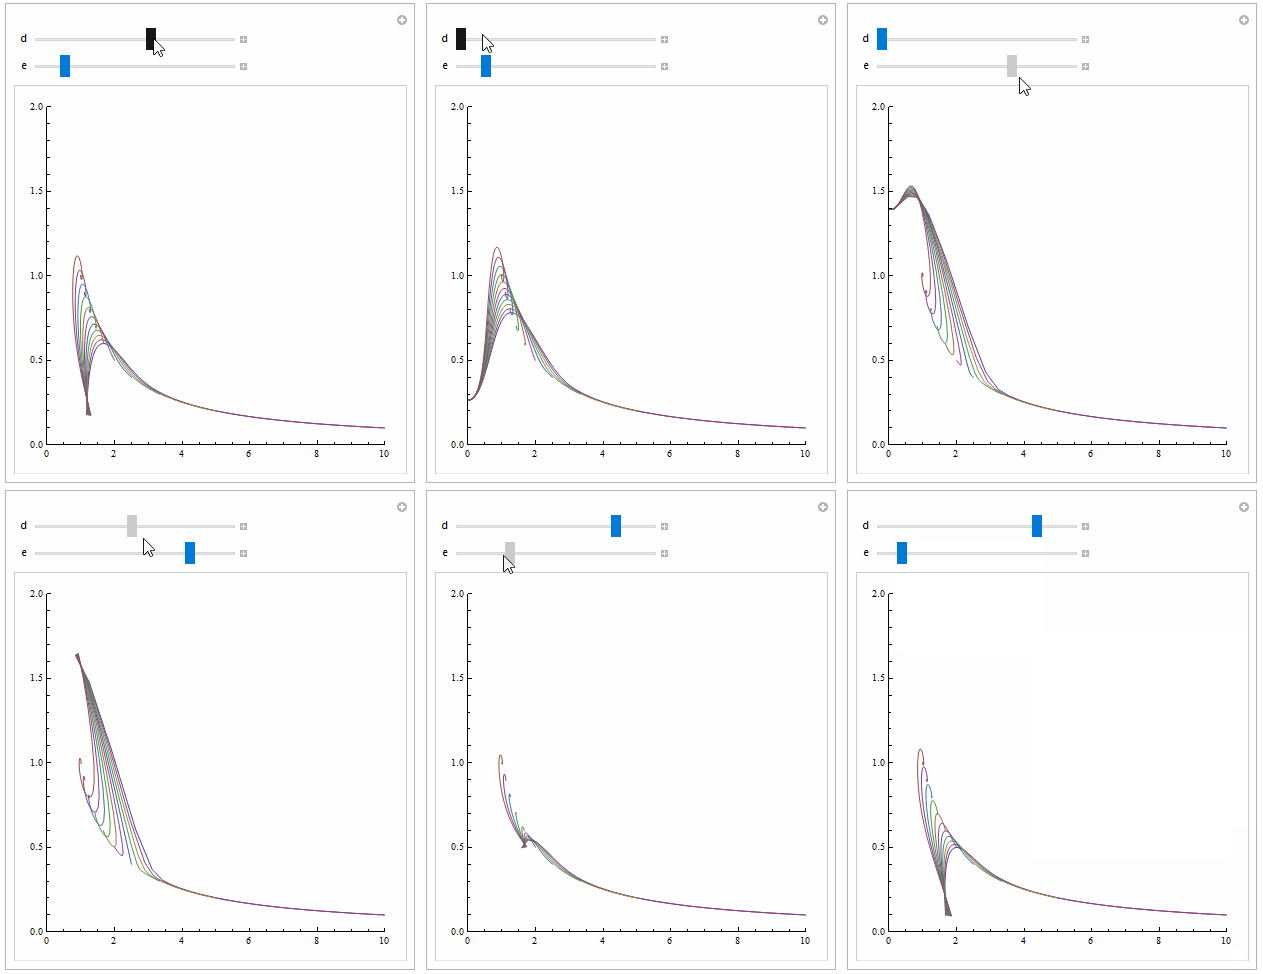
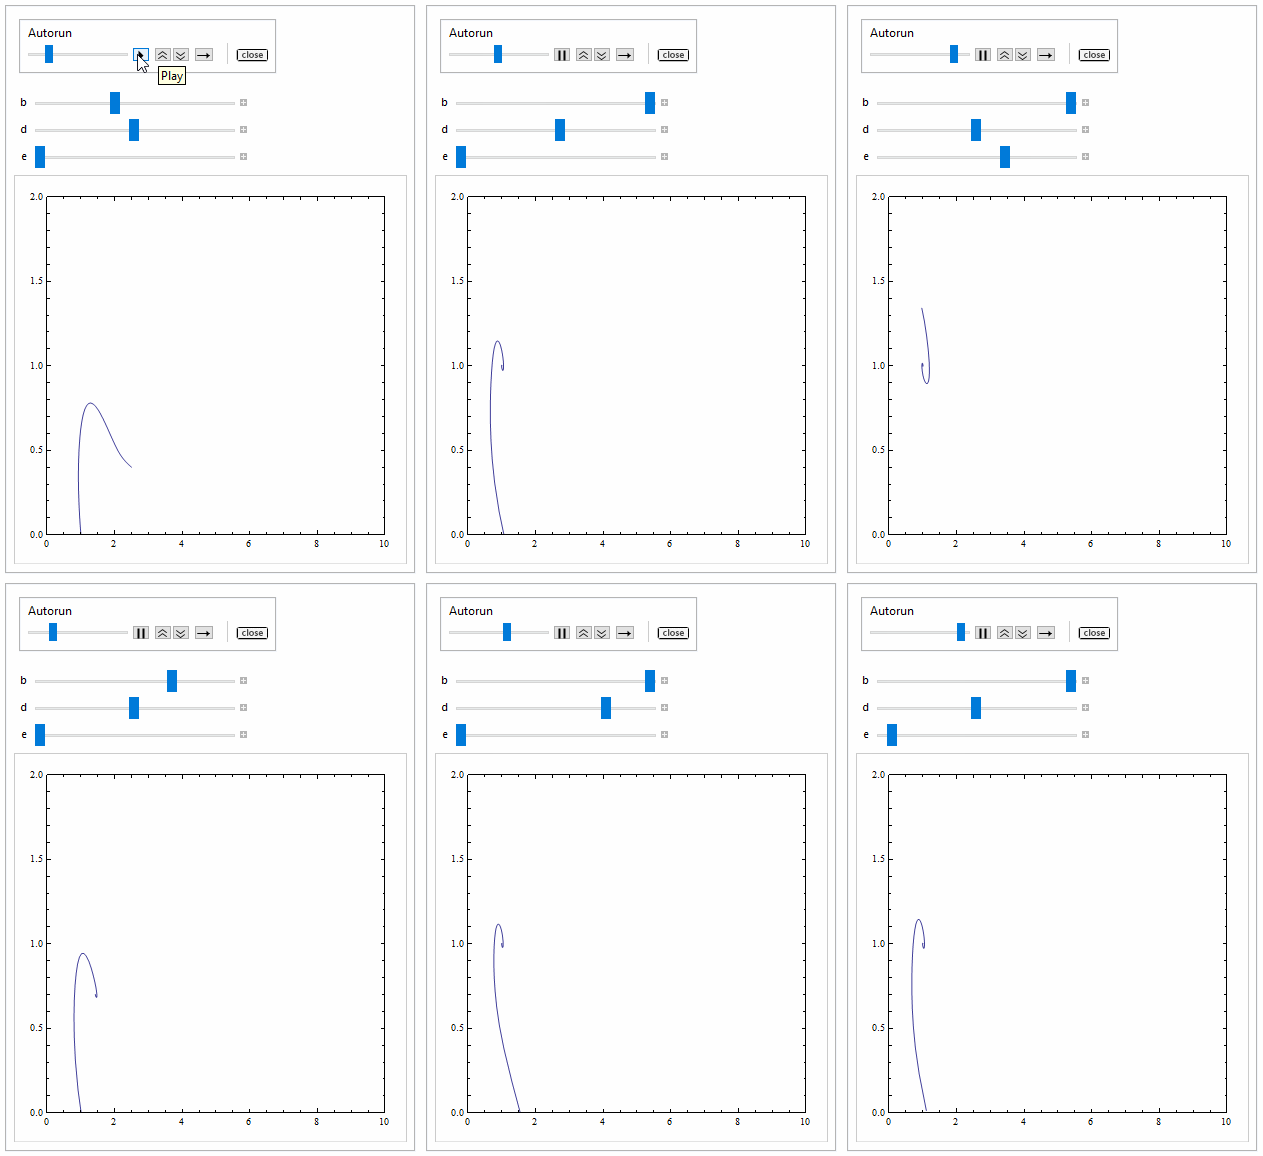
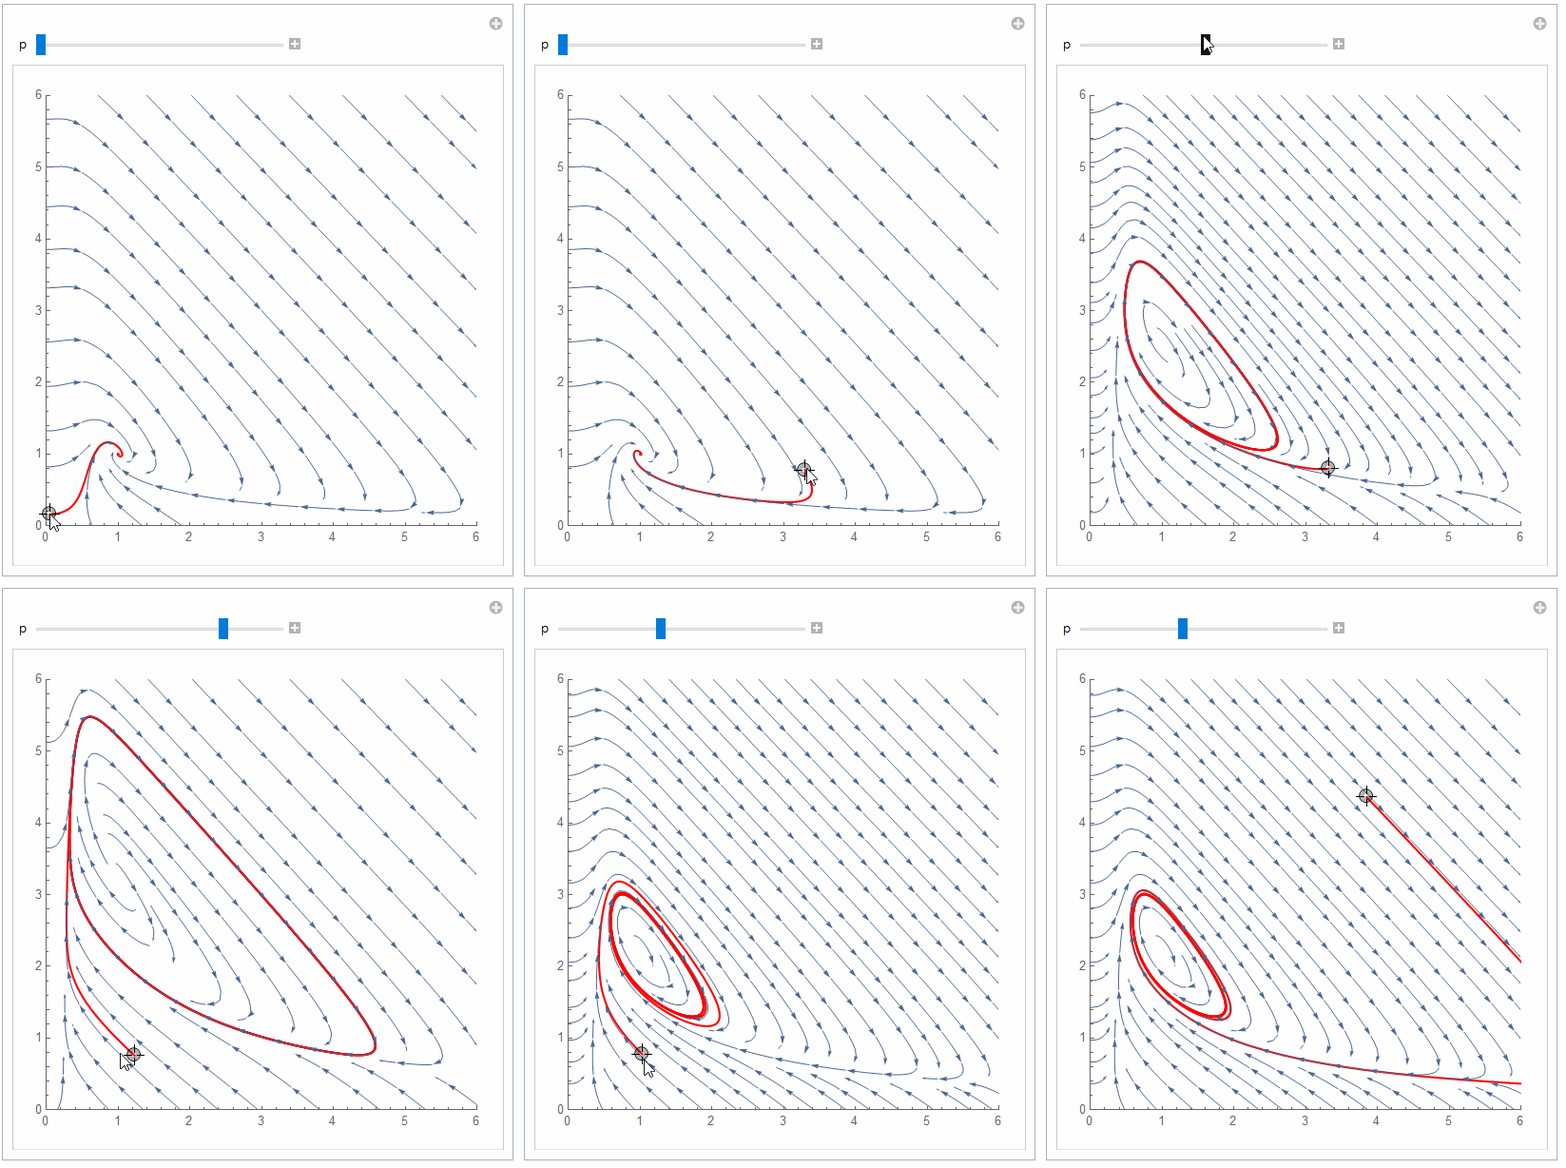
I'm a new user of mathematica. What I'm trying to do is following:
I have two coupled non-linear differential equations. Say
$x'(t)$ = $A− (B +1)x + x^2 y$
$y'(t) = Bx − x^2 y$
What I want is to plot the phase trajectories for 3-5 initial conditions on a single plot and also be able to change the parameter B at will which will show me how the nature of the fixed points change as I change the parameter.
The Problem:
I tried:
sol = NDSolve[{x[b]'[t] ==  1 - (b + 1) x[b][t] + x[t]^2*y[t],
   y'[t] == 1*x[t] - x[t]^2*y[t], x[0.1] == 1, y[0.1] == 0}, {x,
   y}, {t, 0, 50}]


ParametricPlot[{x[t], y[t]} /. sol, {t, 0.1, 50}]
It works very good and fine. But whenever I' trying to put Manipulate so that I can change initial conditions or it's showing error. Also using ParametricNDSolve is showing some error which I am not figuring out at all. Any help is appreciated. Thank you.


