10
$\begingroup$

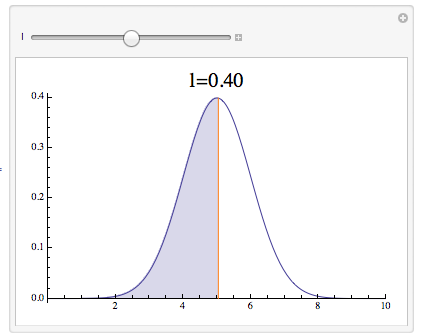
How do I plot a normal curve with filling under the curve and to the right of a vertical line. I would prefer that the vertical line starts at the x-axis and stops at the plotted curve.

Basically trying to shade the area under the curve for a specific region.

$\endgroup$
2
  • 1
    $\begingroup$ Did you look at the Filling option of Plot? $\endgroup$
    – Szabolcs
    Commented Feb 3, 2013 at 18:55
  • 2
    $\begingroup$ Yes, I can fill under the normal pdf curve, it is just how to fill only to the right or left of a specific vertical line? $\endgroup$ Commented Feb 3, 2013 at 19:24

2 Answers 2

10
$\begingroup$

Maybe you could use something like this as a start point:

Manipulate[
    dist=PDF[NormalDistribution[5,1],#]&;
    p1=Plot[dist@x,{x,0,l}
        ,Filling->Axis
        ,PlotRange-> {{0,10},All}
        ];
    p2=Plot[dist@x,{x,l,10}
        ,Filling->None
        ,PlotRange-> {{0,10},All}
        ];
    Show[p1,p2,Epilog->{Orange,Line[{{l,0},{l,dist@l}}]},PlotLabel->Style[#,20]&@Row[{"l=",NumberForm[dist@l,{\[Infinity],2}]}]],
{{l,5.},0,10}
]

enter image description here

$\endgroup$
2
  • $\begingroup$ Excellent -- exactly what I envisioned. And, is it possible to keep the top of the orange line connected to the pdf of the normal diet. line? Such that the top of the line slides along the curve. $\endgroup$ Commented Feb 3, 2013 at 19:20
  • $\begingroup$ Hi Fred. See this updated version. I think that it's what you want. Nice to know that it was what you were looking for.! :) $\endgroup$
    – Murta
    Commented Feb 3, 2013 at 19:35
6
$\begingroup$

Murta's solution works nicely, but there is a way to do what is desired without the fuss of using Show[] and separate instances of Plot[]. Witness the following:

With[{dist = PDF[NormalDistribution[5, 1]], l = 5},
     Plot[{ConditionalExpression[dist[x], x < l], dist[x]}, {x, 0, 10}, 
          Epilog -> {Orange, Line[{{l, 0}, {l, dist @ l}}]}, 
          Filling -> {1 -> Axis}, PlotRange -> {{0, 10}, All}, 
          PlotLabel -> Style[StringForm["l=`1`", NumberForm[dist @ N @ l, {∞, 2}]], 20],
          PlotStyle -> ColorData[1, 1]]]
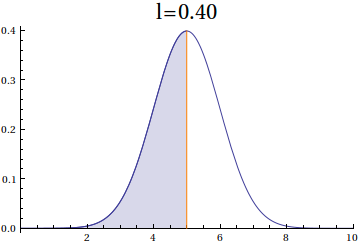
filling under the normal curve

The key here is the tandem use of the specifications in the Filling option to restrict the filling to a single curve, and ConditionalExpression[] to restrict the filling domain.


The Wizard reports the following variation that is useful to people who don't have ConditionalExpression[] handy:

With[{dist = PDF[NormalDistribution[5, 1]], l = 5}, 
     Plot[{If[x < l, dist[x]], dist[x]}, {x, 0, 10}, 
          Epilog -> {Orange, Line[{{l, 0}, {l, dist @ l}}]}, Filling -> {1 -> Axis}, 
          PlotLabel -> Style[StringForm["l=`1`", NumberForm[dist @ N @ l, {∞, 2}]], 20],
          PlotRange -> All, PlotStyle -> ColorData[1, 1]]]
$\endgroup$
1
  • 2
    $\begingroup$ I find it highly amusing that an answer that derives from my answer is more highly regarded than the original. :) $\endgroup$ Commented May 14, 2013 at 9:38

Not the answer you're looking for? Browse other questions tagged or ask your own question.