4
$\begingroup$

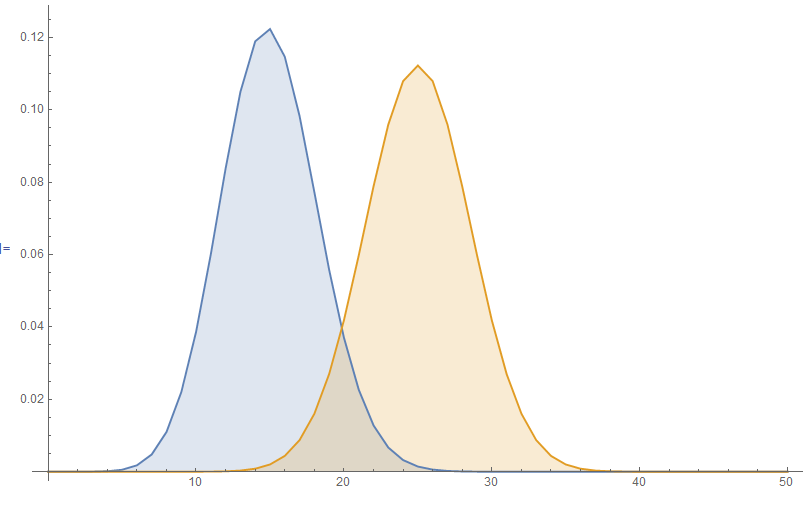
This is an example from ListPlot in the Mathematica documentation.

ListPlot[Table[{k,PDF[BinomialDistribution[50, p], k]}, {p, {0.3, 0.5}}, {k, 0, 50}],
  Filling -> Axis, PlotLegends -> {0.3, 0.5}, Joined -> True]

enter image description here

In this example, I want to limit the filling range from 10.5 to 20.8 on x-axis of the blue one and the filling range from 15.2 to 27.4 on x-axis of the yellow one.

Edit

Actually, my lists are:

list1 = 
  {{-2.,0.}, {-1.9,0.}, {-1.8,0.}, {-1.7,0.}, {-1.6,0.}, {-1.5,0.}, {-1.4,0.}, 
   {-1.3,0.}, {-1.2,0.}, {-1.1,0.}, {-1.,0.}, {-0.9,0.}, {-0.8,0.}, {-0.7,0.}, 
   {-0.6,0.}, {-0.5,0.}, {-0.4,0.}, {-0.3,0.}, {-0.2,0.}, {-0.1, 0.0000270029}, 
   {0.,0.573}, {0.1, 0.944375}, {0.2, 0.905604}, {0.3, 0.876333}, {0.4,0.856429}, 
   {0.5,0.842903}, {0.6,0.833816}, {0.7,0.823825}, {0.8,0.82225}, {0.9,0.820646}, 
   {1.,0.824455}, {1.1,0.820966}, {1.2,0.82971}, {1.3,0.838609}, {1.4,0.833386}, 
   {1.5,0.847014}, {1.6,0.845375}, {1.7,0.831121}, {1.8,0.858744}, {1.9,0.878679}, 
   {2.,0.883768}, {2.1,0.895884}, {2.2,0.916524}, {2.3,0.883408}, {2.4,0.820855}, 
   {2.5,0.812862}, {2.6,0.850007}, {2.7,0.85677}, {2.8,0.917854}, {2.9,0.860092}, 
   {3.,0.826174}};

list2 = 
  {{-2., Indeterminate}, {-1.9, Indeterminate}, {-1.8, Indeterminate}, 
   {-1.7, Indeterminate}, {-1.6, Indeterminate}, {-1.5, Indeterminate}, 
   {-1.4, Indeterminate}, {-1.3, Indeterminate}, {-1.2, Indeterminate}, 
   {-1.1, Indeterminate}, {-1., Indeterminate}, {-0.9, Indeterminate}, 
   {-0.8, Indeterminate}, {-0.7, Indeterminate}, {-0.6, Indeterminate}, 
   {-0.5, Indeterminate}, {-0.4, Indeterminate}, {-0.3, Indeterminate},     
   {-0.2, Indeterminate}, {-0.1, 0.000978548}, {0., 0.0216139}, 
   {0.1, 0.0159094}, {0.2, 0.0246127}, {0.3, 0.0432556}, {0.4, .0698127}, 
   {0.5, 0.100648}, {0.6, 0.13547}, {0.7, 0.171693}, {0.8, 0.210745}, 
   {0.9, 0.251159}, {1., 0.294236}, {1.1, 0.32755}, {1.2, 0.367015}, 
   {1.3, 0.398382}, {1.4, 0.402279}, {1.5, 0.405745}, {1.6, 0.370707}, 
   {1.7, 0.343634}, {1.8, 0.325424}, {1.9, 0.325361}, {2., 0.28044}, 
   {2.1, 0.330616}, {2.2, 0.272563}, {2.3, 0.281717}, {2.4, 0.37461}, 
   {2.5, 0.433955}, {2.6, 0.210232}, {2.7, 0.276848}, {2.8, 0.39585}, 
   {2.9, 0.55642}, {3., 1.53635}};

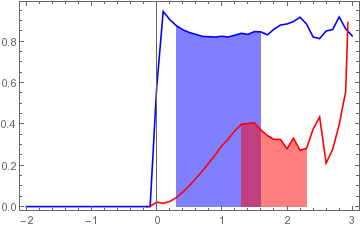
When the lists are like this, how can I limit the filling ranges along the x-axis from 0.23 to 1.67 in list1 and from 1.23 to 2.34 in list2?

$\endgroup$
1
  • $\begingroup$ Workaround: use Interpolation[] with InterpolationOrder -> 1 on your points, and use the techniques in the thread corey linked to. $\endgroup$ Commented Dec 19, 2016 at 8:38

2 Answers 2

4
$\begingroup$

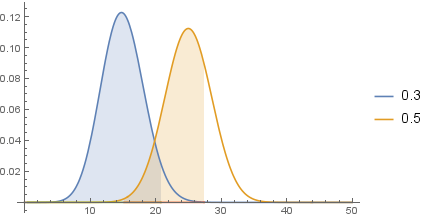
Using Plot

Plot[{PDF[BinomialDistribution[50, .3], x], 
  PDF[BinomialDistribution[50, .5], x], 
  ConditionalExpression[0, .5 <= x <= 20.8], 
  ConditionalExpression[0, 15.2 <= x <= 27.4]}, {x, 0, 50}, 
 Filling -> {1 -> {3}, 2 -> {4}}, PlotLegends -> {0.3, 0.5}, 
 Evaluated -> True, PlotRange -> All]

Mathematica graphics

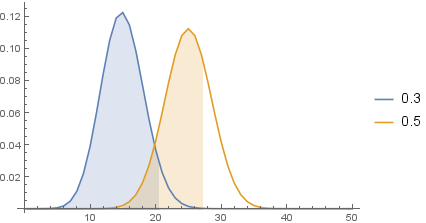
Using ListPlot

table1 = Table[{k, PDF[BinomialDistribution[50, p], k]}, {p, {0.3, 0.5}}, {k, 0, 50}];
lim[p_] := Switch[p, .3, {.5, 20.8}, .5, {15.2, 27.4}];
table2 = Table[{k, 0}, {p, {.3, .5}}, {k, lim[p][[1]], lim[p][[2]]}];

ListPlot[Join @@ {table1, table2}, Filling -> {1 -> {3}, 2 -> {4}},
 PlotLegends -> {.3, .5}, Joined -> True, PlotRange -> All]

Mathematica graphics

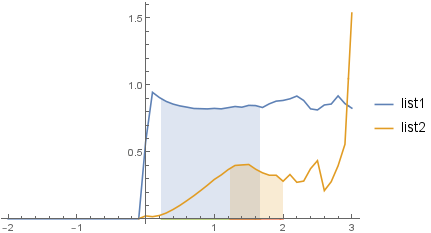
Update: for "the real question", you can do

table1 = {list1, list2};
l = {{.23, 1.67}, {1.23, 2, 34}};
table2 = Table[{k, 0}, {p, 2}, {k,l[[p,1]],l[[p,2]], (l[[p,2]] - l[[p,1]])/10}];

ListPlot[Join @@ {table1, table2}, Filling -> {1 -> {3}, 2 -> {4}}, 
 PlotLegends -> {"list1", "list2"}, Joined -> True, PlotRange -> All]

Mathematica graphics

$\endgroup$
5
  • 1
    $\begingroup$ That's for Plot[]; what if one only has a list of points and thus has to use ListPlot[]? $\endgroup$ Commented Dec 19, 2016 at 8:37
  • 1
    $\begingroup$ @J.M., I updated with a version that works with ListPlot. $\endgroup$
    – kglr
    Commented Dec 19, 2016 at 11:59
  • $\begingroup$ @kglr thank you! actually, I added my real question. I should have asked my question directly, I'm sorry. Could you check my added question please? I think your answer is very close to my solution for the problem. thanks. $\endgroup$ Commented Dec 20, 2016 at 1:28
  • 1
    $\begingroup$ @TaeshinKim, please see the update. $\endgroup$
    – kglr
    Commented Dec 20, 2016 at 1:40
  • $\begingroup$ @kglr this is what I really want! Thank you! :) $\endgroup$ Commented Dec 20, 2016 at 1:52
1
$\begingroup$

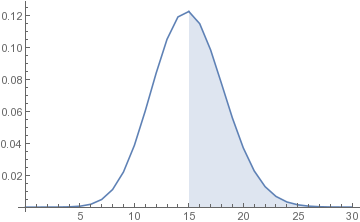
You can split your data (not a good way, but it does the job)

data = Table[{k, PDF[BinomialDistribution[50, 0.3], k]}, {k, 0, 30}];
d1 = Select[data, #[[1]] <= 15 &];
d2 = Select[data, #[[1]] >= 15 &];
Show[ListLinePlot[d1], ListLinePlot[d2, Filling -> Axis], 
PlotRange -> All]

enter image description here

For any set of data and a range x1,x2

filling[list__, x1_, x2_, col_] := Show[ListLinePlot[list, PlotStyle -> col], 
          ListLinePlot[Select[list, x1 <= #[[1]] <= x2 &], PlotStyle -> None, Filling -> 0, 
          FillingStyle -> Directive[Opacity[0.5], col]], PlotRange -> All]

Show[filling[list1, 0.23, 1.67, Blue],filling[list2, 1.23, 2.34, Red], Frame -> True]

enter image description here

$\endgroup$
2
  • $\begingroup$ good approach. thanks. I will try it. if you have a time, could you check my added question? thx. $\endgroup$ Commented Dec 20, 2016 at 1:32
  • $\begingroup$ @kglr solved my problem. thx! $\endgroup$ Commented Dec 20, 2016 at 1:56

Not the answer you're looking for? Browse other questions tagged or ask your own question.