4
$\begingroup$
b1={1.8743,1.8784,1.88248,1.89049,1.89828,1.90587,1.91327,1.96335,2.03035,2.12536,2.23701,2.30098,2.34255,2.37175,2.3934,2.42334,2.44307,2.48725,2.51208,2.5173,2.52799,2.53164,2.53348,2.53533,2.53625,2.53745,2.53793,2.53894,2.53909,2.53543};
ks1={0.01,1.,2.,4.,6.,8.,10.,25.,50.,100.,200.,300.,400.,500.,600.,800.,1000.,2000.,4000.,5000.,10000.,15000.,20000.,30000.,40000.,70000.,100000.,1.*10^6,1.*10^8,1.*10^12};
data1 = Transpose[{ks1, b1}];
s1 = ListLogLinearPlot[data1, Joined -> True, 
  PlotStyle -> {Black, Thickness[0.01]}, AxesStyle -> Black, 
  PlotRange -> All]

How to put star symbol on same plot which traces the curve. I know with the Plot marker we can achive this, but the thing is I want the tracing at equidistance from start to end. With my data points, I am not getting the tracing properly. How to achive this.

$\endgroup$
4
  • $\begingroup$ "I want the tracing at equidistance from start to end." - you did quite a bit of a jump here. You have data points, but placing a star at each of these data points is not what you want? What exactly do you mean by "equidistance", distance along the curve that interpolates your data points? $\endgroup$ Commented Jan 5, 2019 at 14:01
  • $\begingroup$ I mean I want to trace the curve which is formed by a data points, between the data the line is traced. now all I have is a line. I want to place star from start to end with placement being at an equal distance $\endgroup$
    – acoustics
    Commented Jan 5, 2019 at 14:06
  • $\begingroup$ I meant to say just treat the curve as a contious curve and I wanted to mark the star from start to end $\endgroup$
    – acoustics
    Commented Jan 5, 2019 at 14:15
  • $\begingroup$ A related question. $\endgroup$ Commented Jan 5, 2019 at 14:31

2 Answers 2

6
$\begingroup$

One can use the undocumented MeshFunctions -> {"ArcLength"} option setting to place equispaced (by the arclength of the interpolating curve) markers:

Normal[ListLogLinearPlot[Transpose[{ks1, b1}], Joined -> True, 
                         Mesh -> 6, MeshFunctions -> {"ArcLength"}, MeshStyle -> Red, 
                         PlotStyle -> {Black, Thickness[0.01]}]] /. 
Point[pt_] :> Inset[Style["\[FivePointedStar]", Large], pt]

equispaced markers

$\endgroup$
4
  • $\begingroup$ Can we make the star unfilled with colour $\endgroup$
    – acoustics
    Commented Jan 5, 2019 at 14:33
  • 2
    $\begingroup$ Yes, just replace "\[FivePointedStar]" with "☆". Or, take your pick among the symbols listed here. $\endgroup$ Commented Jan 5, 2019 at 14:37
  • 1
    $\begingroup$ Hm. I cannot help but to me, this does not look equidistantly spaced with respect to arclength... $\endgroup$ Commented Jan 5, 2019 at 16:32
  • 1
    $\begingroup$ @Henrik, I will try to investigate tomorrow, as I have just borrowed a friend's computer to write some answers (and check on you guys ;)), and I have to go back home. The problem is that it's not immediately clear how ListLogLinearPlot[] is interpolating the points (and it wasn't the cubic interpolant when I did a check before posting). $\endgroup$ Commented Jan 5, 2019 at 16:46
9
$\begingroup$

As Henrik Schumacher correctly points out in the comments, the stars on the plot produced by the naive application of the undocumented MeshFunctions -> {"ArcLength"} option

do not look equidistantly spaced with respect to arclength

It took me a while to figure out what happens. The reason is that scales in the vertical and horizontal directions of the plot differ by an order of magnitude. I tried other plotting functions like ListPlot, Plot, ParametricPlot and found that all of them also suffer from this issue.

The following approach solves the problem exactly.

We start by defining our data1:

b1={1.8743,1.8784,1.88248,1.89049,1.89828,1.90587,1.91327,1.96335,2.03035,2.12536,2.23701,2.30098,2.34255,2.37175,2.3934,2.42334,2.44307,2.48725,2.51208,2.5173,2.52799,2.53164,2.53348,2.53533,2.53625,2.53745,2.53793,2.53894,2.53909,2.53543};
ks1={0.01,1.,2.,4.,6.,8.,10.,25.,50.,100.,200.,300.,400.,500.,600.,800.,1000.,2000.,4000.,5000.,10000.,15000.,20000.,30000.,40000.,70000.,100000.,1.*10^6,1.*10^8,1.*10^12};
data1 = Transpose[{ks1, b1}];

Now define future AspectRatio of the plotting area (the option AspectRatio determines the actual aspect ratio of the plotting area with PlotRangePadding included):

aspectRatio = 1./GoldenRatio;

The Graphics produced by ListLogLinearPlot contains log-transformed data plotted in the usual linear cordinate system (it is just Ticks what creates the illusion of a logarithmic coordinate system):

data1Log = {Log@#1, #2} & @@@ data1;
dataRange = MinMax /@ Transpose[data1Log];

Now create rescaling function and its inverse:

t = RescalingTransform[
   MinMax /@ Transpose[data1Log], {{0, 1}, {0, aspectRatio}}];
tInv = InverseFunction[t];

This function makes vertical and horizontal scales equal in Graphics.

Then we use MeshFunctions -> {"ArcLength"} for generating the equidistantly spaced points with respect to arclength:

s2 = ListLinePlot[t[data1Log], PlotRange -> All, 
   MeshFunctions -> {"ArcLength"}, Mesh -> True];

Extracting the equidistant points and performing the inverse coordinate transform:

pts = tInv @@@ Cases[Normal[s2], _Point, -1];

Now we can use these coordinates for placing the star glyphs in Epilog:

Show[ListLogLinearPlot[data1, Joined -> True, PlotStyle -> {Black, Thickness[0.01]}, 
  AxesStyle -> Black, PlotRange -> All, 
  Epilog -> {Red, Translate[Inset[Style["☆", 15, Bold], {0, 0}], pts]}, 
  AspectRatio -> aspectRatio], PlotRange -> dataRange, PlotRangePadding -> Scaled[.05]]
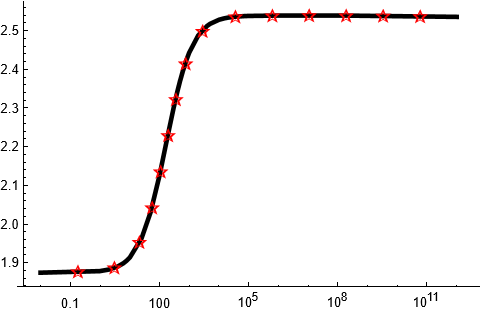
plot

Note however that Mathematica can't guarantee exact positioning for the font glyphs on the plot. ResourceFunction["PolygonMarker"] guarantees exact positioning of the markers:

Show[ListLogLinearPlot[data1, Joined -> True, PlotStyle -> {Black, Thickness[0.01]}, 
  AxesStyle -> Black, PlotRange -> All, 
  Epilog -> {FaceForm[], EdgeForm[Red], 
    ResourceFunction["PolygonMarker"]["FivePointedStar", Offset[5], pts]}, 
  AspectRatio -> aspectRatio], PlotRange -> dataRange, PlotRangePadding -> Scaled[.05]]
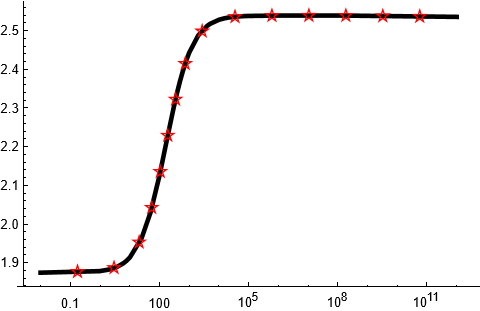
plot

Voila! :)


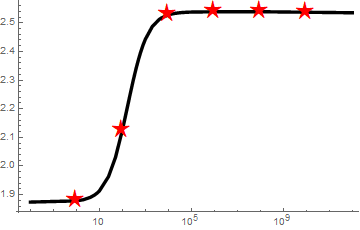
UPDATE: I just accidentally found that I knew about MeshFunctions -> {"ArcLength"} already several years ago but completely forgot due to non-use of this functionality. I can add to that old post that now we have the wonderful GraphicsInformation function by Carl Woll which simplifies things considerably.

$\endgroup$
1

Your Answer

By clicking “Post Your Answer”, you agree to our terms of service and acknowledge you have read our privacy policy.

Not the answer you're looking for? Browse other questions tagged or ask your own question.